
China: In stabilisation mode

Following a recent research trip (May 2025), Naomi Waistell, co-manager of Carmignac Portfolio Emergents, shares on-the-ground insights into the country’s economic stabilisation efforts but warns about the widening gaps. Micro-level factors are expected to drive broader macro trends, resulting on select alpha opportunities, and less certainty on market performance beta.
The China Conundrum
The atmosphere on the ground in China is certainly more positive than in September 2024 when we last visited. The raft of policy announcements which were delivered later that month marked a significant turning point, an acknowledgement that the current condition of the Chinese economy, dragged down by deflation could not be allowed to persist. However, what was at that time touted as China’s ‘whatever it takes’ moment, has faded to ‘more is needed’. This has left a gap between the short-term expectations of industry and the market, and the reactive reality of how policymaking is undertaken in the world’s second largest economy. Many companies and market participants we met with spoke of a new round of large stimulus support with imminence in a notable disconnect to ministry representatives who emphasized the government will want to see the impact of existing polices first and then assess what may be needed. Part of the problem is a gap in the transmission mechanism between policy introduction and market implementation. Practically, local governments are the bottleneck, limited by their own debt burdens with insufficient capital capacity to support full take up. A solution to this is not clear. Goals are longer term in China, and there is greater societal acceptance of a period of hardship. The high growth years were based on a booming real estate market which drove confidence in living conditions, wealth and future revenue growth. A reignition of this kind of virtuous cycle is not yet in sight. H2 could get worse before it gets better, as pulled-forward trade demand could lead to softer exports as this is digested. With investment already an inflated proportion of GDP and trade now being hit, a further rise in investment is firstly harder, but also risks coming at the cost of other things such as lower productivity and higher debt to GDP.
A Two Speed Economy
As a result, a two-speed economy appears to be emerging. Whilst exports and manufacturing continue to provide support to the economy, the property market is yet to recover and a new sustainable growth cycle must be predicated on re-igniting confidence in consumers.
Robust growth in manufacturing and exports is set against a slowdown in the real estate sector and subdued domestic consumption.

Lower tier cities will recover much more slowly and inequalities will widen – how this sits with Xi’s ‘common prosperity’ agenda is tricky. The hope is that as high tier cities get richer there will be wealth transfer to lower tier locations and over time those more fragile areas can will become prosperous. Below the top 20-30 cities we are unlikely to see a recovery in the near-term. Even in the tier 2 cities we travelled to the scale of the over-build and presence of buildings sitting empty, unfinished and deserted was inescapable.
Overcapacity and weak domestic demand is still causing deflationary pressures and there is little sign as yet of the long-touted and much needed ‘rebalancing’ towards a consumer-driver growth model. To achieve this demand-side issues need to be addressed: raising personal income levels, providing social protection, promoting productive employment, education and Hukou system reform. Getting the consumption engine going will take time and require a lot of reform, efforts there do not yet go far enough. Anecdotally, when we ate out in restaurants we were often the only table, or one of two tables being served, and taxi drivers we spoke to were former Goldman Sachs and Intertek employees. Consumer confidence remains weak, as evidenced by the volatile earnings season across the Chinese consumer sector. At 30% of global manufacturing capacity and 18% of global population but just 13% of global consumption, the over-capacity remains striking1.
Encouragingly, since returning from the trip and on the back of worsening deflationary trends, the government is showing the first signs of intent to rationalise the supply excesses, vowing to fight so-called ‘involution’. In a July address the Chinese leader, Xi Jinping listed key growth industries and posed the question: ‘Do all provinces in the country have to develop industries in these directions? […] We should not only focus on how much GDP has grown and how many major projects have been built, but also on how much debt is owed.’ It is a significant move. The overcapacity, destructive internal competition and race-to-the-bottom that had characterised some industries has now been harnessed and whilst the short-term impacts of this new policy are likely to dampen GDP growth, it should lift the manufacturing sector, help to tame deflation and the display of greater discipline and action should provide some reassurance for equity market investors.
Additionally, we are now seeing the Chinese credit impulse pick-up at the margin and a widening of the deficit to 15% of GDP. These stimulative effects – not yet widely recognised – amount to around 4% of GDP.

Whilst these moves make us more cautiously optimistic on China’s economic direction, the problem remains that the scale of the property market and its drag on the economy are simply so large that this current stimulus is not enough. More will be needed. We expect to see renewed pressure and an increased policy response later in the year.
Making China Great Again
Importantly, we see a near-zero probability of a complete relationship breakdown between China and the US in the short term, the hegemonic rivalry has been there for some time and in the end they both simply need each other far too much. What’s more and more apparent this time is that China has too many cards to play to kowtow. The more exciting development to our mind is the rise of China’s trade with other emerging markets, or ‘the global south’. Decades of diversification have made China, and emerging markets more generally, less vulnerable to US policy shifts. The transformation in trade patterns has been remarkable, at the turn of the millennium the US was the largest trade partner for 80% of emerging markets. Across the intervening 25 years this has almost completely reversed and China is now the key trade partner for 65% of emerging markets. Indeed the share of EM to EM trade has doubled over the last 35 years and now represents 49% of all EM trade, up from 24% in 1990. Meanwhile, EM trade with the US has dwindled in importance from 18% to 12% over the same period. This demonstrates the growing interconnectedness of emerging markets and helps to explain the recent resilience in Chinese exports as lower trade with developed partners who have become far more protectionist has been fully offset by this new paradigm.

Whilst we are cognizant of the risk of further tariff-related wranglings, the peak shock of US tariff announcements is now, we hope, behind us, and from this point domestic Chinese policy will be the more critical factor for asset prices and equity market returns. In China, Trump is nicknamed ‘Make China Great Again’. His destructive tariffs policies have been a political gift, with The Party now able to frame the economic woes as American-caused and so invoke a nationalism that unifies the people and strengths the political hand of the CCP. Young Chinese now take far more pride in Chinese products, brands and innovation than I have experienced for some time. Previously, Western companies’ products and services have been in turn either revered or boycotted. Now, ‘we don’t really care’ locals say – this indifference is new and speaks to an internal confidence that has not been there before, and could be important in shaping the next phase for China.
Two Key Positive Trends
China as innovator not imitator
The government’s focus is very clearly now on science and technology. The US is still ahead by some margin, but DeepSeek shocked both markets earlier this year, and after years of underestimation this has rendered China more confident and more hungry. Our view is that the US leading here is not a bad thing, it will drive China upwards and China’s end market applications appear wider. In meetings at the technology conference we attended there was palpable hype around robotics and autonomous driving. Humanoid robotics, particularly, has a way to go, and even the best can currently perform only low skilled tasks and not always with accuracy. But there is something of an irony in that China, long being dubbed ‘the factory of the world’, will have more applications for this kind of labour replacement and far greater installed capacity for training. For the economics to make sense from a labour-cost arbitrage point of view will take some time, but China’s development now has clearly moved beyond simple labour-arbitrage to leading innovation. We would also like to emphasize that healthcare, and specifically biotech, should be viewed through a similar lens as information technology in terms of IP. In this field China really are able to achieve global firsts and in certain niches carve out superior solutions. These are the kinds of opportunity we look for.

Hong Kong Capital Markets Renaissance
Secondly, the Hong Kong market is experiencing a renaissance. Remaining restrictions on mainland China IPOs as well as an increasing ‘anything but America’ trade has led to improved demand and liquidity in Hong Kong and revitalized interest in Chinese assets. With the market no longer tarnished as ‘uninvestible’, international capital is returning and the government are more comfortable in promoting the equity market as an alternative for retail investors who have suffered dramatic impairment in asset value and propensity to spend following the demise of the property market. The Hong Kong market, given its greater external dynamism as well as the smaller scale, is being thought of as the first area to prop up, and the government has been active in intervening to buy ETFs in size, with the hope that success there will raise confidence and help to pull up the mainland market. There are now, reportedly, hundreds of IPOs queuing to list in Hong Kong. So far this year the IPO market has raised close to $15bn, up ~500% yoy though still far below the levels of the 2020 peak.
The mainland A-Share market has typically traded at a marked premium to equivalent H-Share listings, but robust recent gains have seen this A-H premium narrow to trade at 24%, the lowest level for 5 years. This is in part owning to renewed foreign investor demand for quality Chinese companies, but more significantly due to exceptional strength in southbound connect flows as local Chinese investors diversify. The existence of this widely accepted A-Share premium in the China market is in fact a phenomenon of only the last ten years, becoming more pronounced following the market disruption of 2015 where a worsening balance of payments pressured the RMB. Whilst investors using the southbound connect are frequently shorter-term in nature, we believe closer equilibrium of H-Share prices to their A-Share equivalents could be structural, as ultimately these are exactly the same stocks and should not be valued with a significant premium in either direction! Notably, the recent H-Share IPO for leading lithium battery maker CATL has risen more than 60% since its May listing and fully inverted this A-H premium with the H-Share now trading 37% above the CATL A-Share valuation. This is testament to the demand for high quality companies with strong governance and globally competitive innovation listed on a liquid and efficient market which can deliver much sough-after returns in China.
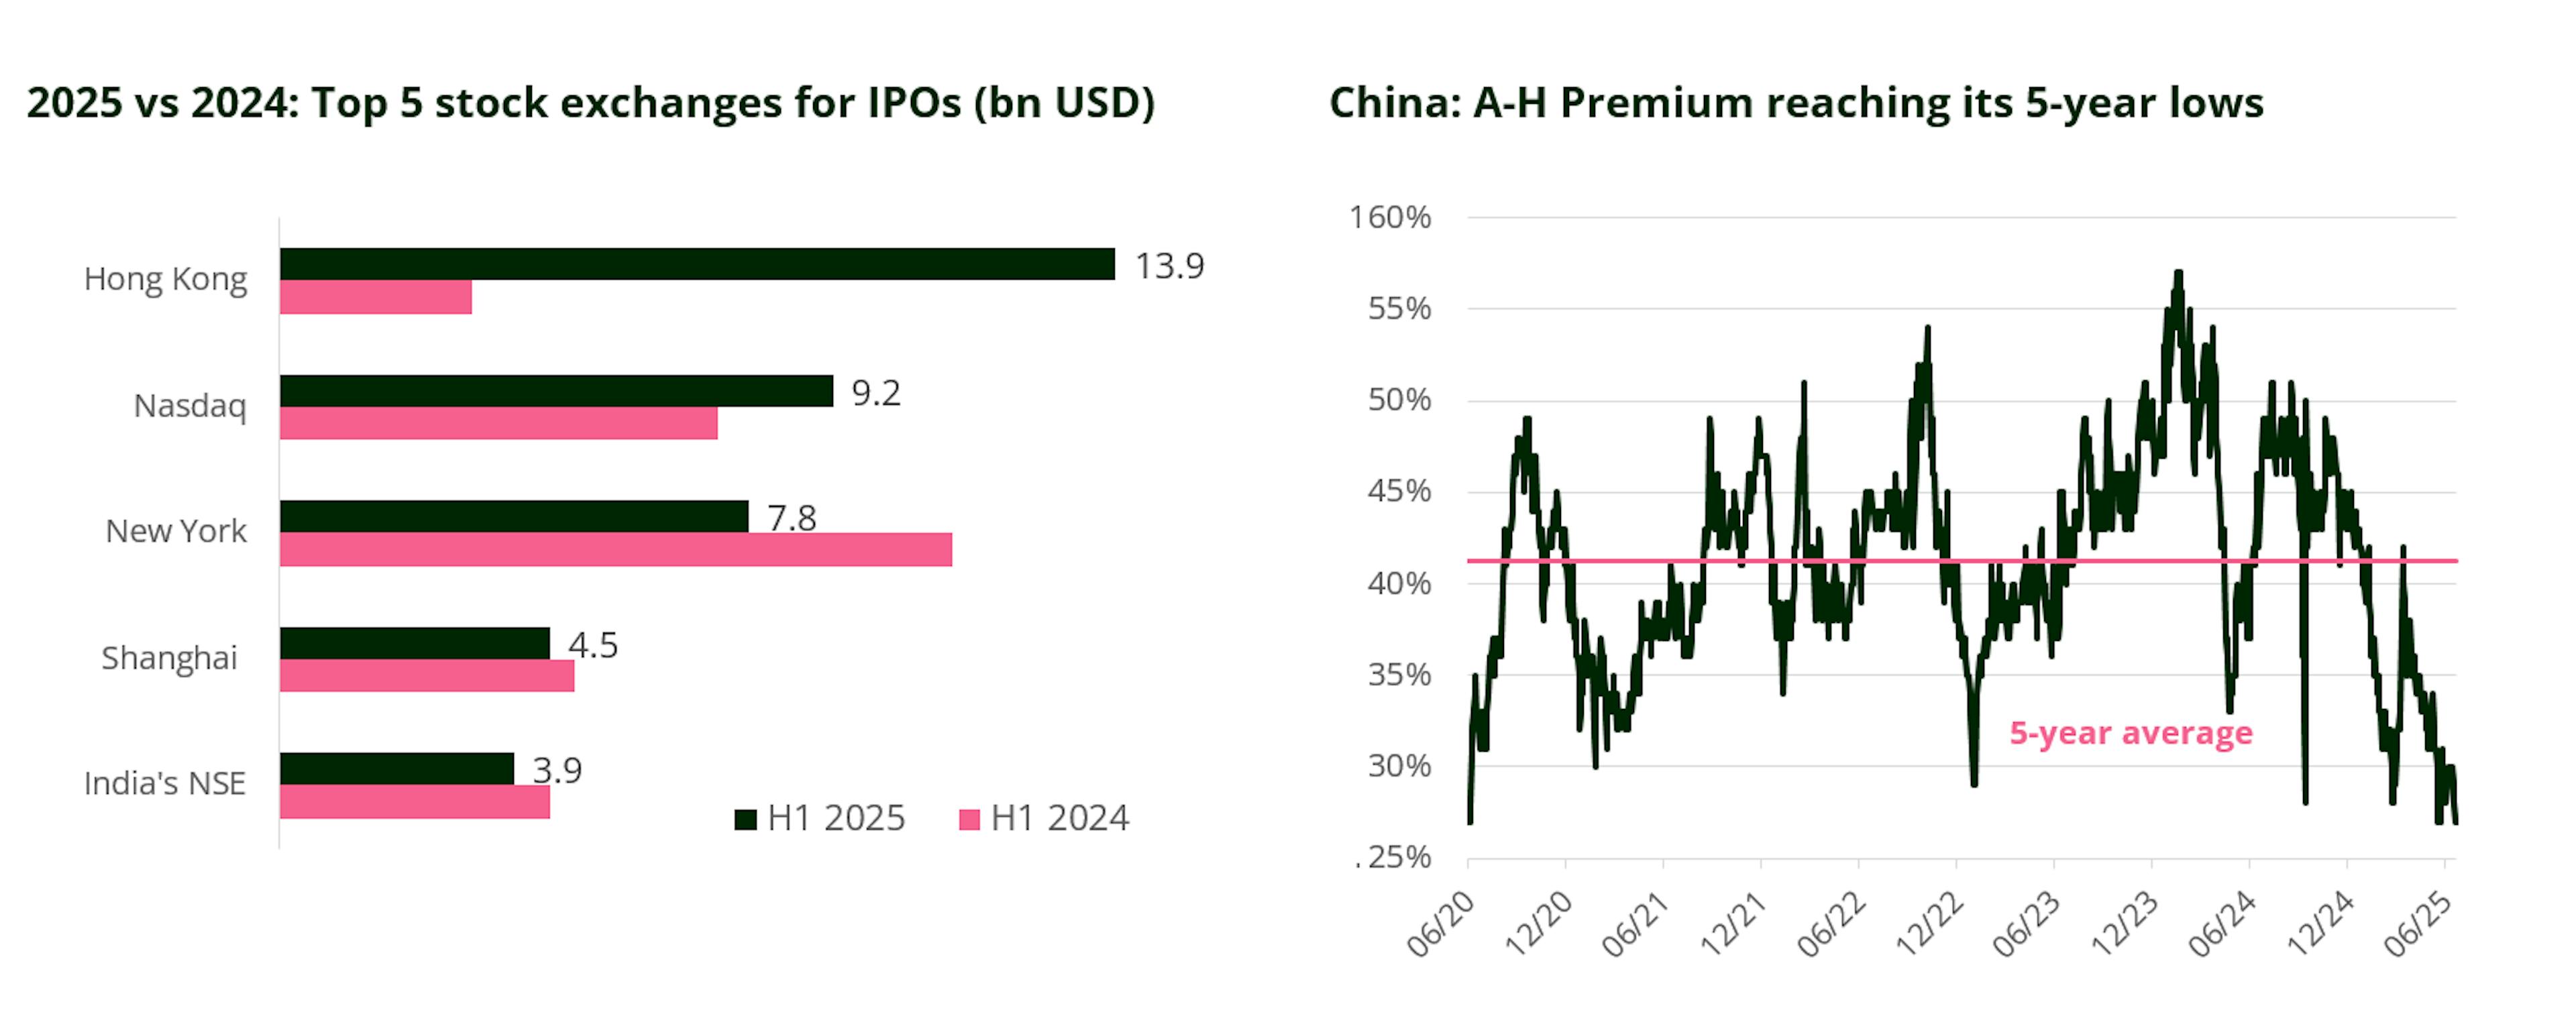
Factors such as easing trade tensions, China’s ‘DeepSeek’ moment and still attractive market valuations in relative terms has buoyed flows. We are encouraged that foreign capital is willing to pay an H Share premium for unique, quality Chinese names with scarcity value, though we will always retain our own valuation prudence. Part of the recent Hong Kong IPO flurry is due to renewed fears of US ADR delisting for Chinese companies. This manifestation of the US-China tensions into markets is a constant presence which spikes in saliency with the waves of protectionism. It’s something we’ve seen before and do not believe this latest pressure – seemingly ignited by US Treasury Secretary Bessent’s remark that ‘everything is on the table’ – will have a catastrophic outcome for Chinese ADRs, but we acknowledge that whilst the threat lingers there will be an unhelpful overhang on US-listed Chinese companies without a dual listing at home.
Final Thoughts
Some of the recent performance in China may have run too far, too fast at the index level, and this is a market in which we expect alpha rather than beta to remain key, retaining high selectivisim in the opportunities we invest in. There are a few areas in which we see continued growth support, these include: AI enablers, the experience economy, wellness, future mobility, education, financialisation and ‘can’t live without’ platforms. Earnings in China have now been doing well, in an EM context and valuations in some pockets look stretched as momentum is ridden. The overall market level is now roughly back to where it was prior to April 2nd. In this context we are minded not to chase these areas, but to wait for entry points or find anomalies within the space of domestic innovation, whilst taking a cautious view on domestic demand.
Away from growth and innovation there is a second strong trend witnessed in high yield names. With lower confidence in a near-term economic recovery these companies offer resilience and attractive shareholder returns. Dividends now represent an attractive yield vs. bond yield and buybacks in the Chinese market are at all-time highs with room for further growth given strong free cash flow levels. We expect this trend to continue and look for opportunities in either the structural innovation or high return camps – anything outside of this looks challenging. The trade war, which may not be resolved so soon, provides an opportunity for China, and if our view is that we are in stabilization mode, perhaps stablility might just be enough, when the other world super power is currently anything but!
Focus on stock picking opportunities

Past performance is not necessarily indicative of future performance. The return may increase or decrease as a result of currency fluctuations *5-year performance: from 31/12/2019 to 31/12/2024. **For Carmignac Emergents, Carmignac Portfolio Emergents.
Reference to certain securities and financial instruments is for illustrative purposes to highlight stocks that are or have been included in the portfolios of funds in the Carmignac range. This is not intended to promote direct investment in those instruments, nor does it constitute investment advice. The Management Company is not subject to prohibition on trading in these instruments prior to issuing any communication. The portfolios of Carmignac funds may change without previous notice.

Carmignac Emergents A EUR Acc
- Recommended minimum investment horizon
- 5 years
- Risk indicator*
- 4/7
- SFDR - Fund Classification**
- Article 9
*Risk Scale from the KID (Key Information Document). Risk 1 does not mean a risk-free investment. This indicator may change over time. **Sustainable Finance Disclosure Regulation (SFDR) 2019/2088. The SFDR classification of the Funds may change over time.
Main risks of the fund
Fees
- Entry costs
- 4.00% of the amount you pay in when entering this investment. This is the most you will be charged. Carmignac Gestion doesn't charge any entry fee. The person selling you the product will inform you of the actual charge.
- Exit costs
- We do not charge an exit fee for this product.
- Management fees and other administrative or operating costs
- 1.80% of the value of your investment per year. This estimate is based on actual costs over the past year.
- Performance fees
- 20.00% max. of the outperformance once performance since the start of the year exceeds that of the reference indicator and if no past underperformance still needs to be offset. The actual amount will vary depending on how well your investment performs. The aggregated cost estimation above includes the average over the last 5 years, or since the product creation if it is less than 5 years.
- Transaction Cost
- 0.35% of the value of your investment per year. This is an estimate of the costs incurred when we buy and sell the investments underlying the product. The actual amount varies depending on the quantity we buy and sell.
Performance
| Carmignac Emergents | +5.2 | +4.6 | +9.5 | −15.6 | −10.7 | +44.7 | +24.7 | −18.6 | +18.8 | +1.4 |
| Reference Indicator | +1.7 | +14.7 | +6.1 | −14.9 | +4.9 | +8.5 | +20.6 | −10.3 | +20.6 | +14.5 |
| Carmignac Emergents | +6.1% | +4.9% | +4.0% |
| Reference Indicator | +5.5% | +5.9% | +4.3% |
Source: Carmignac at 30 Jun 2025.
Past performance is not necessarily indicative of future performance. Performances are net of fees (excluding possible entrance fees charged by the distributor). The Fund presents a risk of loss of capital.
The return may increase or decrease as a result of currency fluctuations, for the shares which are not currency-hedged.
Reference Indicator: MSCI EM NR index
Carmignac Portfolio Emergents F EUR Acc
- Recommended minimum investment horizon
- 5 years
- Risk indicator*
- 4/7
- SFDR - Fund Classification**
- Article 9
*Risk Scale from the KID (Key Information Document). Risk 1 does not mean a risk-free investment. This indicator may change over time. **Sustainable Finance Disclosure Regulation (SFDR) 2019/2088. The SFDR classification of the Funds may change over time.
Main risks of the fund
Fees
- Entry costs
- We do not charge an entry fee.
- Exit costs
- We do not charge an exit fee for this product.
- Management fees and other administrative or operating costs
- 1.15% of the value of your investment per year. This estimate is based on actual costs over the past year.
- Performance fees
- 20.00% when the share class overperforms the Reference indicator during the performance period. It will be payable also in case the share class has overperformed the reference indicator but had a negative performance. Underperformance is clawed back for 5 years. The actual amount will vary depending on how well your investment performs. The aggregated cost estimation above includes the average over the last 5 years, or since the product creation if it is less than 5 years.
- Transaction Cost
- 0.39% of the value of your investment per year. This is an estimate of the costs incurred when we buy and sell the investments underlying the product. The actual amount varies depending on the quantity we buy and sell.
Performance
| Carmignac Portfolio Emergents | +5.5 | +5.5 | +9.8 | −14.3 | −10.3 | +44.9 | +25.5 | −18.2 | +19.8 | +1.7 |
| Reference Indicator | +1.7 | +14.7 | +6.1 | −14.9 | +4.9 | +8.5 | +20.6 | −10.3 | +20.6 | +14.5 |
| Carmignac Portfolio Emergents | +6.8% | +5.6% | +4.5% |
| Reference Indicator | +5.5% | +5.9% | +4.3% |
Source: Carmignac at 30 Jun 2025.
Past performance is not necessarily indicative of future performance. Performances are net of fees (excluding possible entrance fees charged by the distributor). The Fund presents a risk of loss of capital.
The return may increase or decrease as a result of currency fluctuations, for the shares which are not currency-hedged.
Reference Indicator: MSCI EM NR index