
Carmignac Portfolio Merger Arbitrage Plus: Letter from the Fund Managers
Dear investors,
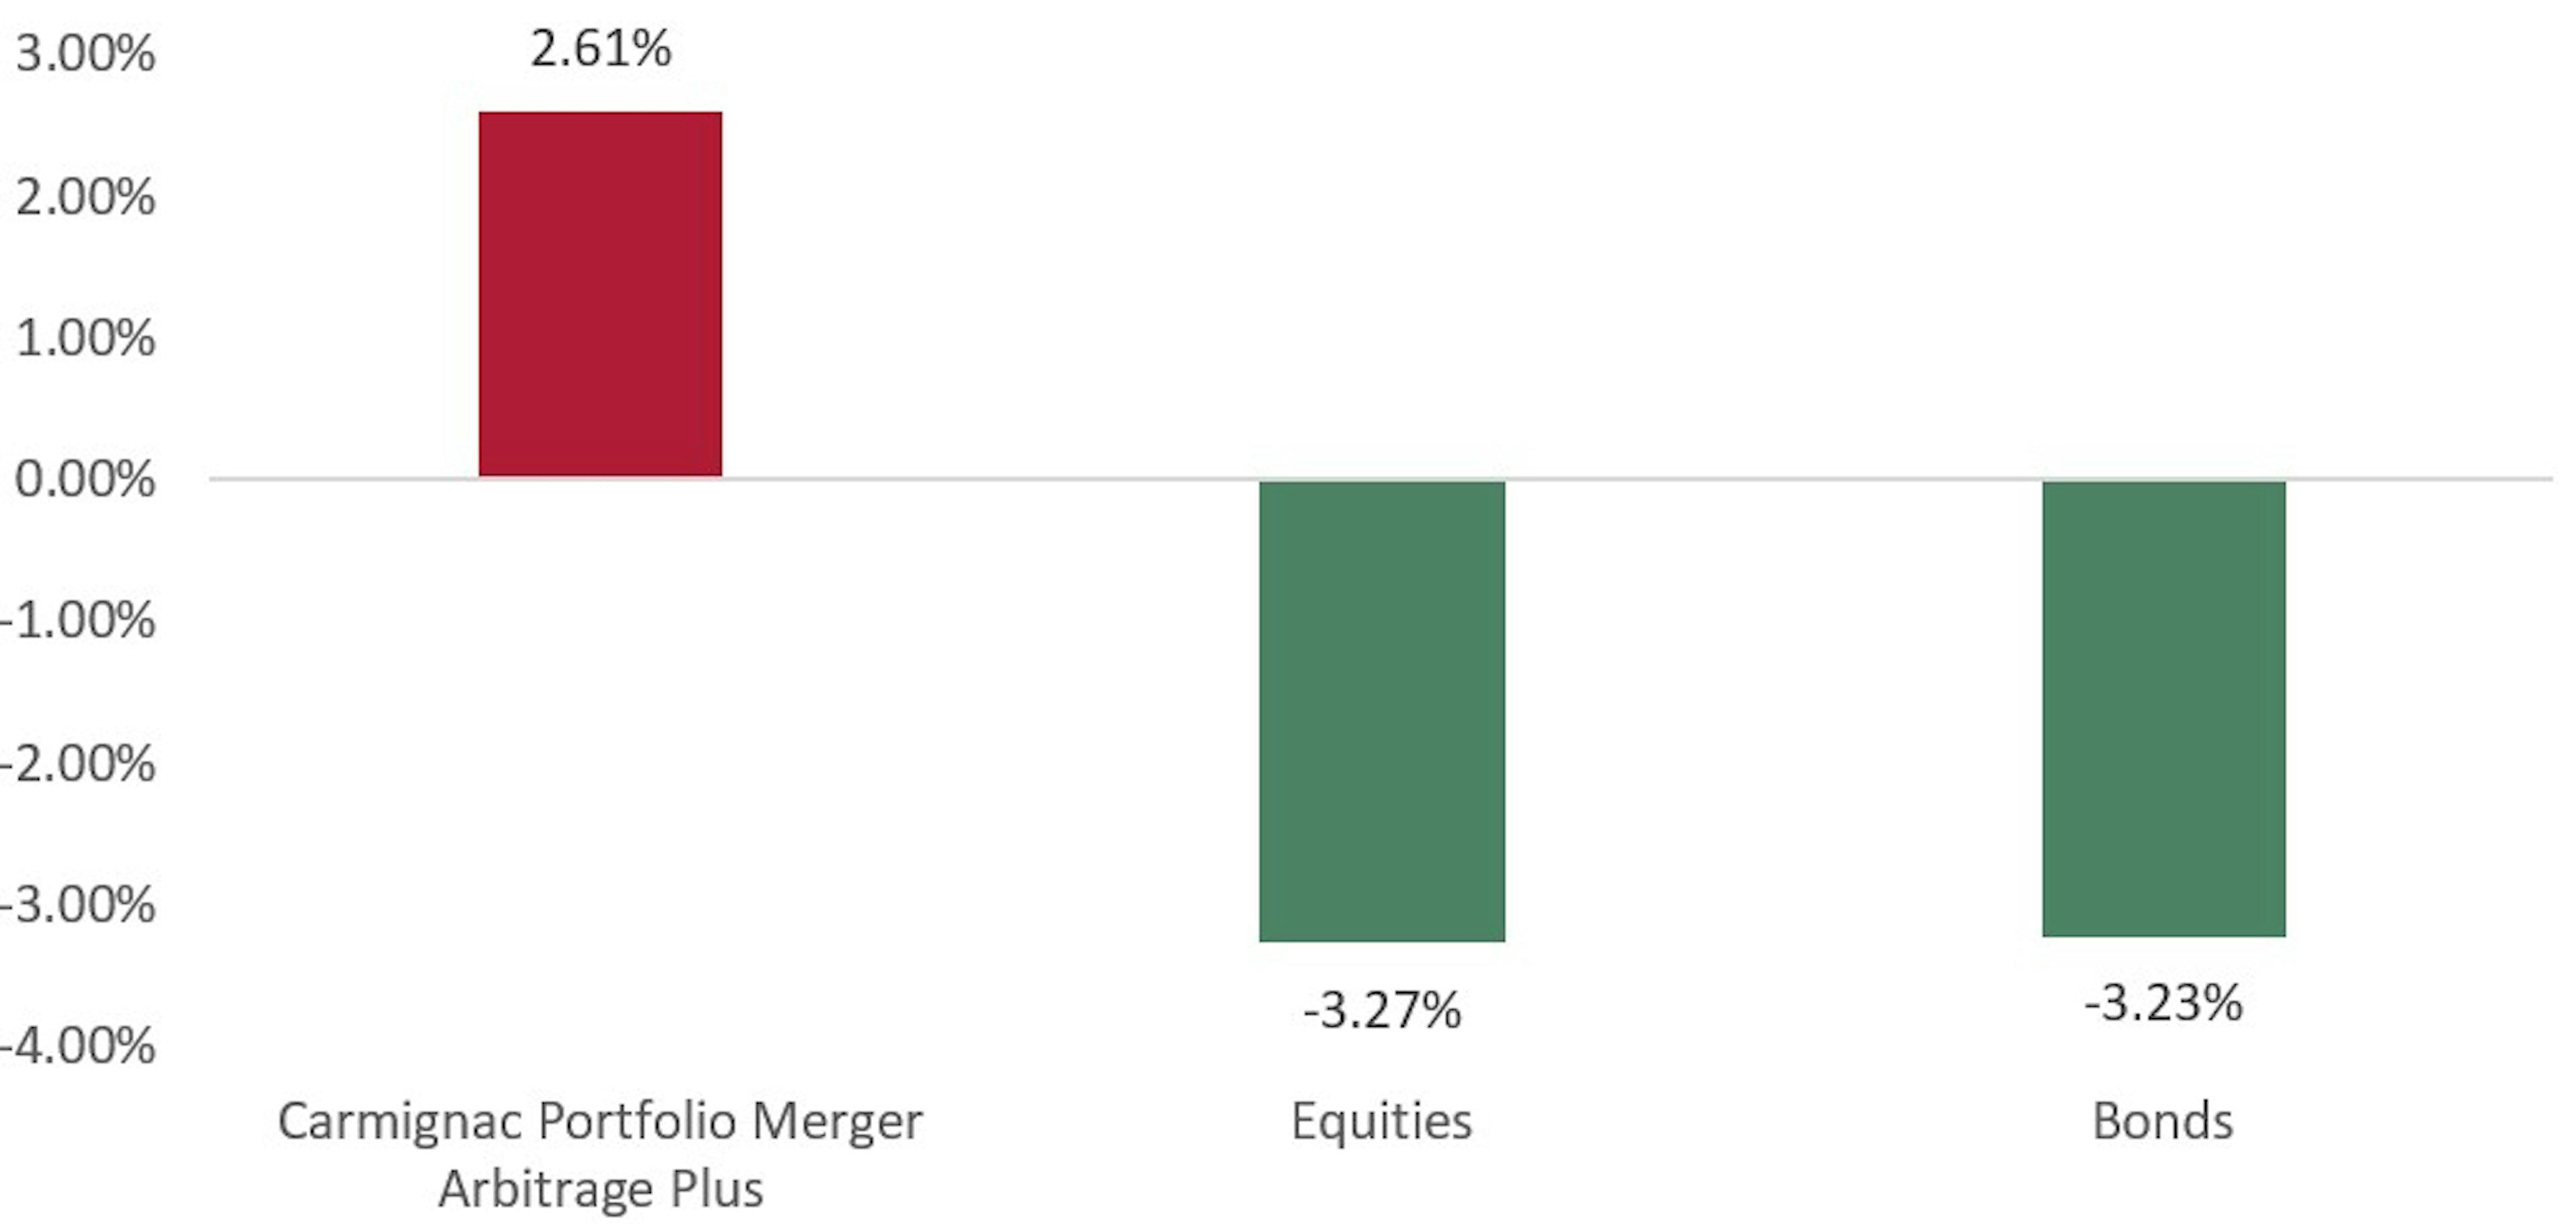
Carmignac Portfolio Merger Arbitrage Plus gained 2.61% (class I shares in EUR) in the third quarter of 2023, driven mainly by an easing of the “antitrust pressure” that had been weighing on some high-profile M&A deals.
The US Federal Trade Commission (FTC) and its UK counterpart, the Competition and Markets Authority (CMA), attempted to block Microsoft’s $69 billion acquisition of Activision in the first half of the year, out of concerns that the merged entity would abuse its dominant position in cloud gaming. The FTC also tried to stop another large merger, this time in the pharmaceutical industry: Amgen’s $28 billion takeover of Horizon Therapeutics. The antitrust regulator was worried that Amgen would bundle its own drugs with the more innovative ones from Horizon Therapeutics, which would essentially close off certain market segments to competition. In the wake of these moves by the FTC, two other M&A deals with competition risk – Globus Medical’s $3.1 billion acquisition of NuVasive and Pfizer’s $43 billion purchase of Seagen – saw their merger arbitrage spreads (or discounts) widen in the second quarter.
When the FTC wants to block a merger or acquisition, it files a lawsuit with a US federal court; the judge then examines each party’s arguments – the FTC on one side and the acquiring company on the other – and makes a decision. In the Activision case, the judge quickly approved the takeover since Microsoft agreed to take specific measures to address the FTC’s concerns about competition in the cloud gaming industry. But in the Horizon Therapeutics case, the FTC had a weaker argument and eventually decided to suspend its lawsuit and negotiate an agreement directly with Amgen. Following these developments in the US, the CMA took the rather unusual step of reversing its decision on the Activision deal and allowing the acquisition by Microsoft to go through.
This was good news for arbitrage traders, and it reduced the spreads on both Activision and Seagen. In addition, the NuVasive and Horizon Therapeutics deals closed in Q3 as expected. These four transactions were the main contributors to our Q3 return, accounting for nearly 40% of the gain.
However, two deals in our portfolio didn’t go through to completion, which dragged on performance. First, MaxLinear pulled out of its bid to acquire Silicon Motion Technology just a few days before the deal was to close because it felt that Silicon Motion hadn’t met its contractual obligations. Second, Intel gave up on its attempted takeover of Tower Semiconductor after Chinese regulators failed to approve the deal before the merger agreement expired. These two transactions trimmed nearly 11% off our Q3 return.
Our return was also impacted, albeit to a lesser extent, by heightened volatility in the spreads on iRobot, Capri Holdings, and JSR during the period.
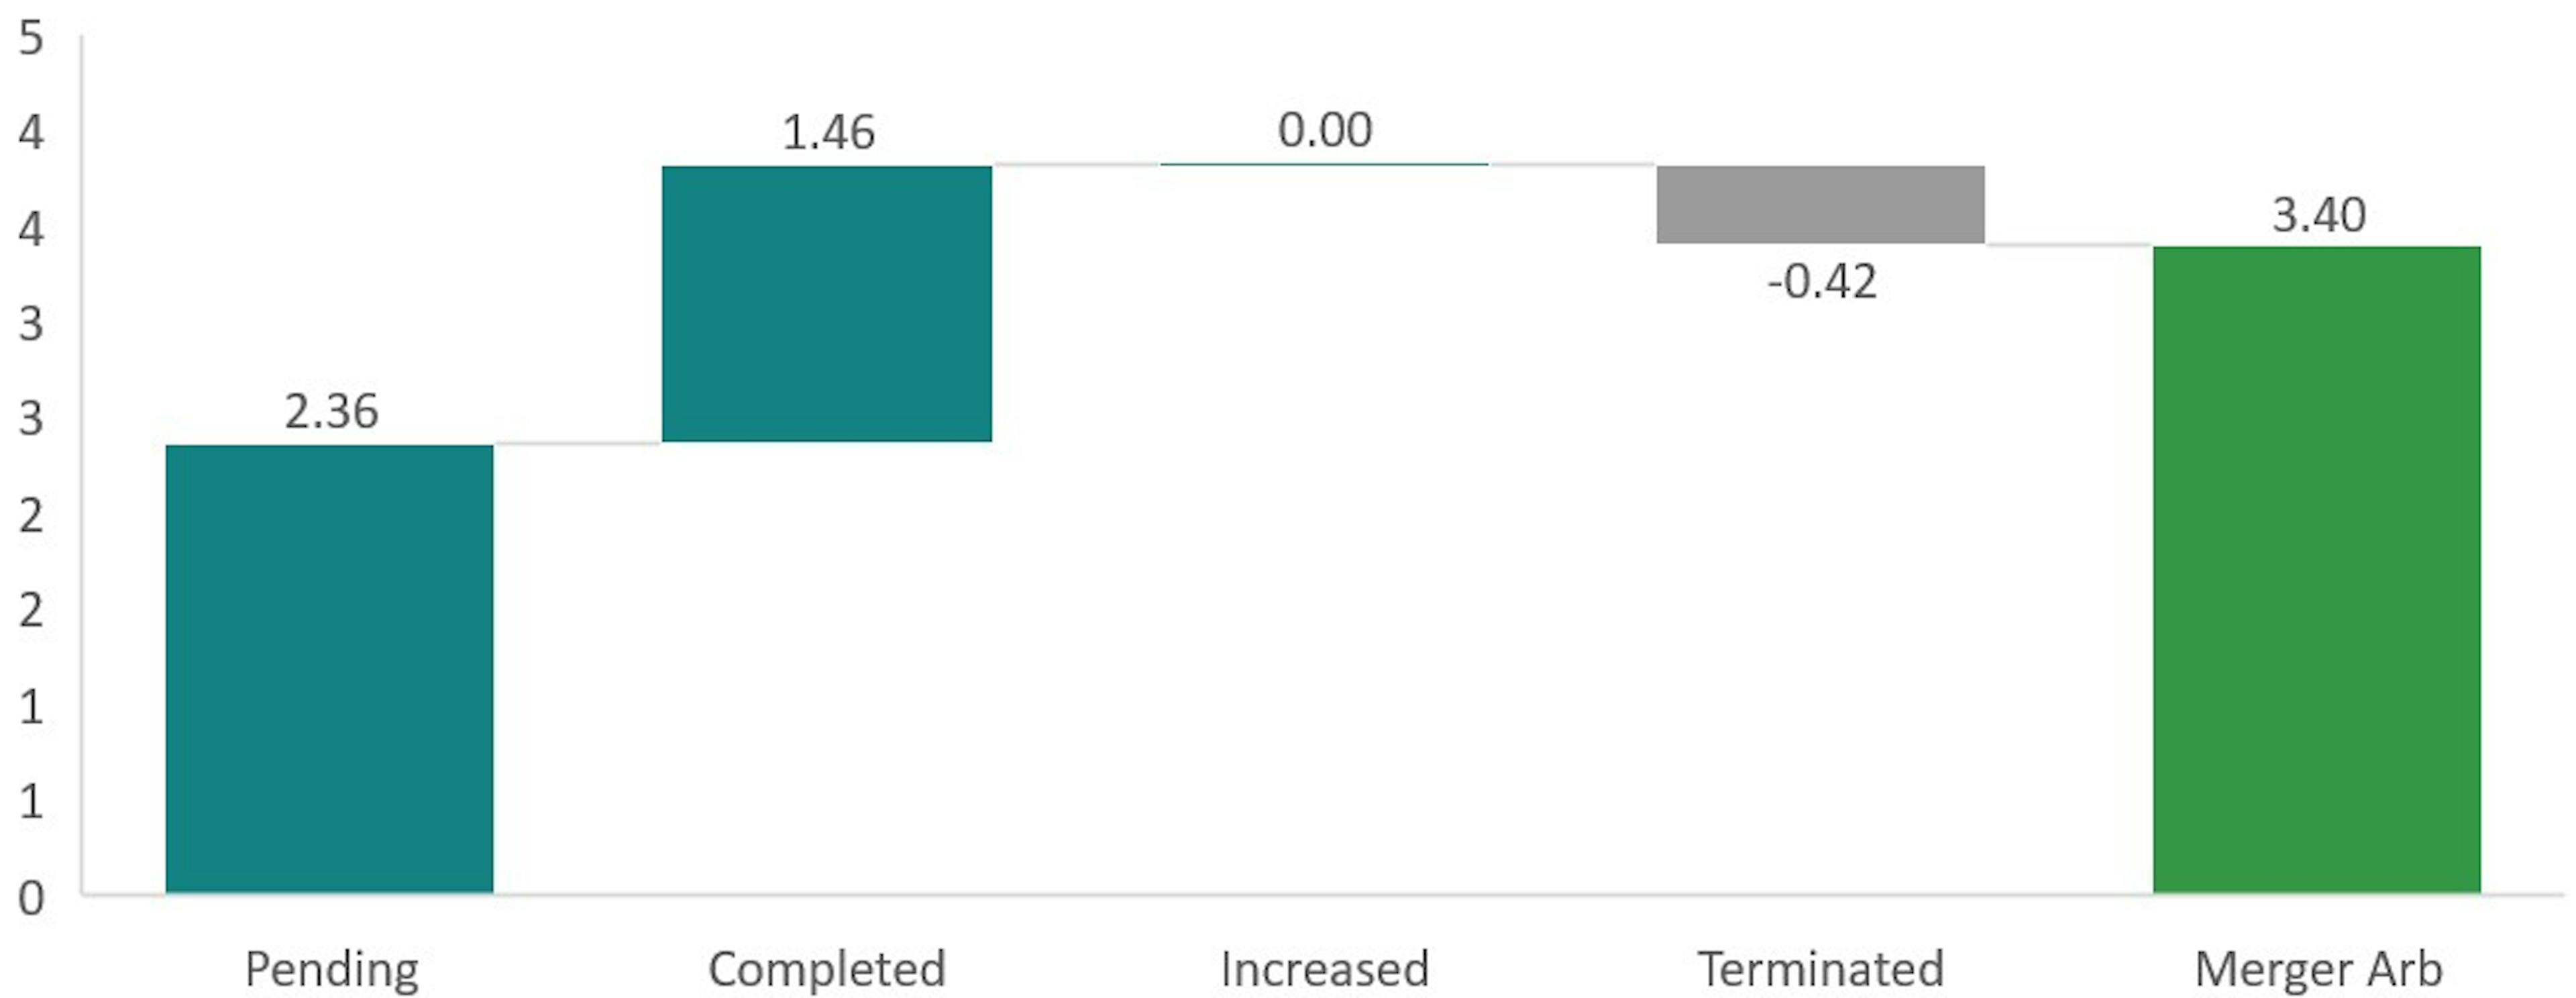
Another way to assess our fund’s performance is to look at where the deals in our portfolio stood at quarter-end. M&A deals can be in one of four phases:
- Pending: The transaction hasn’t yet been completed because certain conditions must still be met;
- Completed: The transaction was carried out under the initial terms;
- Increased: The acquiring company upped its offer price or a third party made a bid at a higher price;
- Terminated: The transaction failed to go through.
The following chart shows our fund’s performance according to this metric:
Carmignac Portfolio Merger Arbitrage Plus Performance Attribution – Q3 2023
Source: Carmignac, 30/09/2023
The tighter spreads on pending deals such as Activision and Seagen (first bar on the left) lifted our return, as did the completed deals like Horizon Therapeutics and NuVasive (second bar from the left). The fourth bar corresponds to the two deals that were terminated: Silicon Motion and Tower Semiconductor. Regarding the third bar, deals with increased bids made a zero contribution to our return, as the current market climate isn’t conducive to bidding wars.
One final highlight of Q3 is that our fund’s performance was uncorrelated with both equities and bonds. We generated a positive return at a time when both those asset classes faced strong headwinds.
Carmignac Portfolio Merger Arbitrage Plus return compared to equities and bonds – Q3 2023
Source: Carmignac, 30/09/2023
Looking at the overall M&A environment, 66 deals eligible for our portfolio were announced in Q3 in the US, Europe, and Asia – a figure in line with the average over roughly the past four quarters. As usual, the US was the biggest market with 55% of eligible deals, while Europe and Asia accounted for 28% and 17%, respectively. The average deal size in the US was $3.9 billion, against $1.0 billion in both Europe and Asia.
A few things stand out in the regional breakdown for Q3:
- In the US, the healthcare and basic materials sectors made up 41% of the total transaction volume (in USD);
- In Europe, the UK was the biggest market with 41% of the total;
- In Asia, 43% of the deals were in the basic materials sector.
This stream of around 20 deals per month enabled us to regularly replace the transactions that exited our portfolio and keep both our deployed funds rate and our portfolio diversification at levels consistent with our investment objectives.
An interesting trend emerged in Q3, although it remains to be confirmed: a return of large M&A deals (>$10 billion) in the US. In September, two packaging companies – WestRock and Smurfit Kappa – agreed to merge and create a $21 billion industry leader, while Cisco announced it would acquire software developer Splunk for $28 billion.
This trend is probably due to the FTC’s recent failed attempts at blocking mega-mergers in key sectors like technology and healthcare. Now that the “antitrust pressure” has eased, potential acquirers will likely be more confident in launching bids – thus increasing the deal flow. Another large-scale transaction was announced in early October: ExxonMobil’s $60 billion takeover of Pioneer Natural Resources.
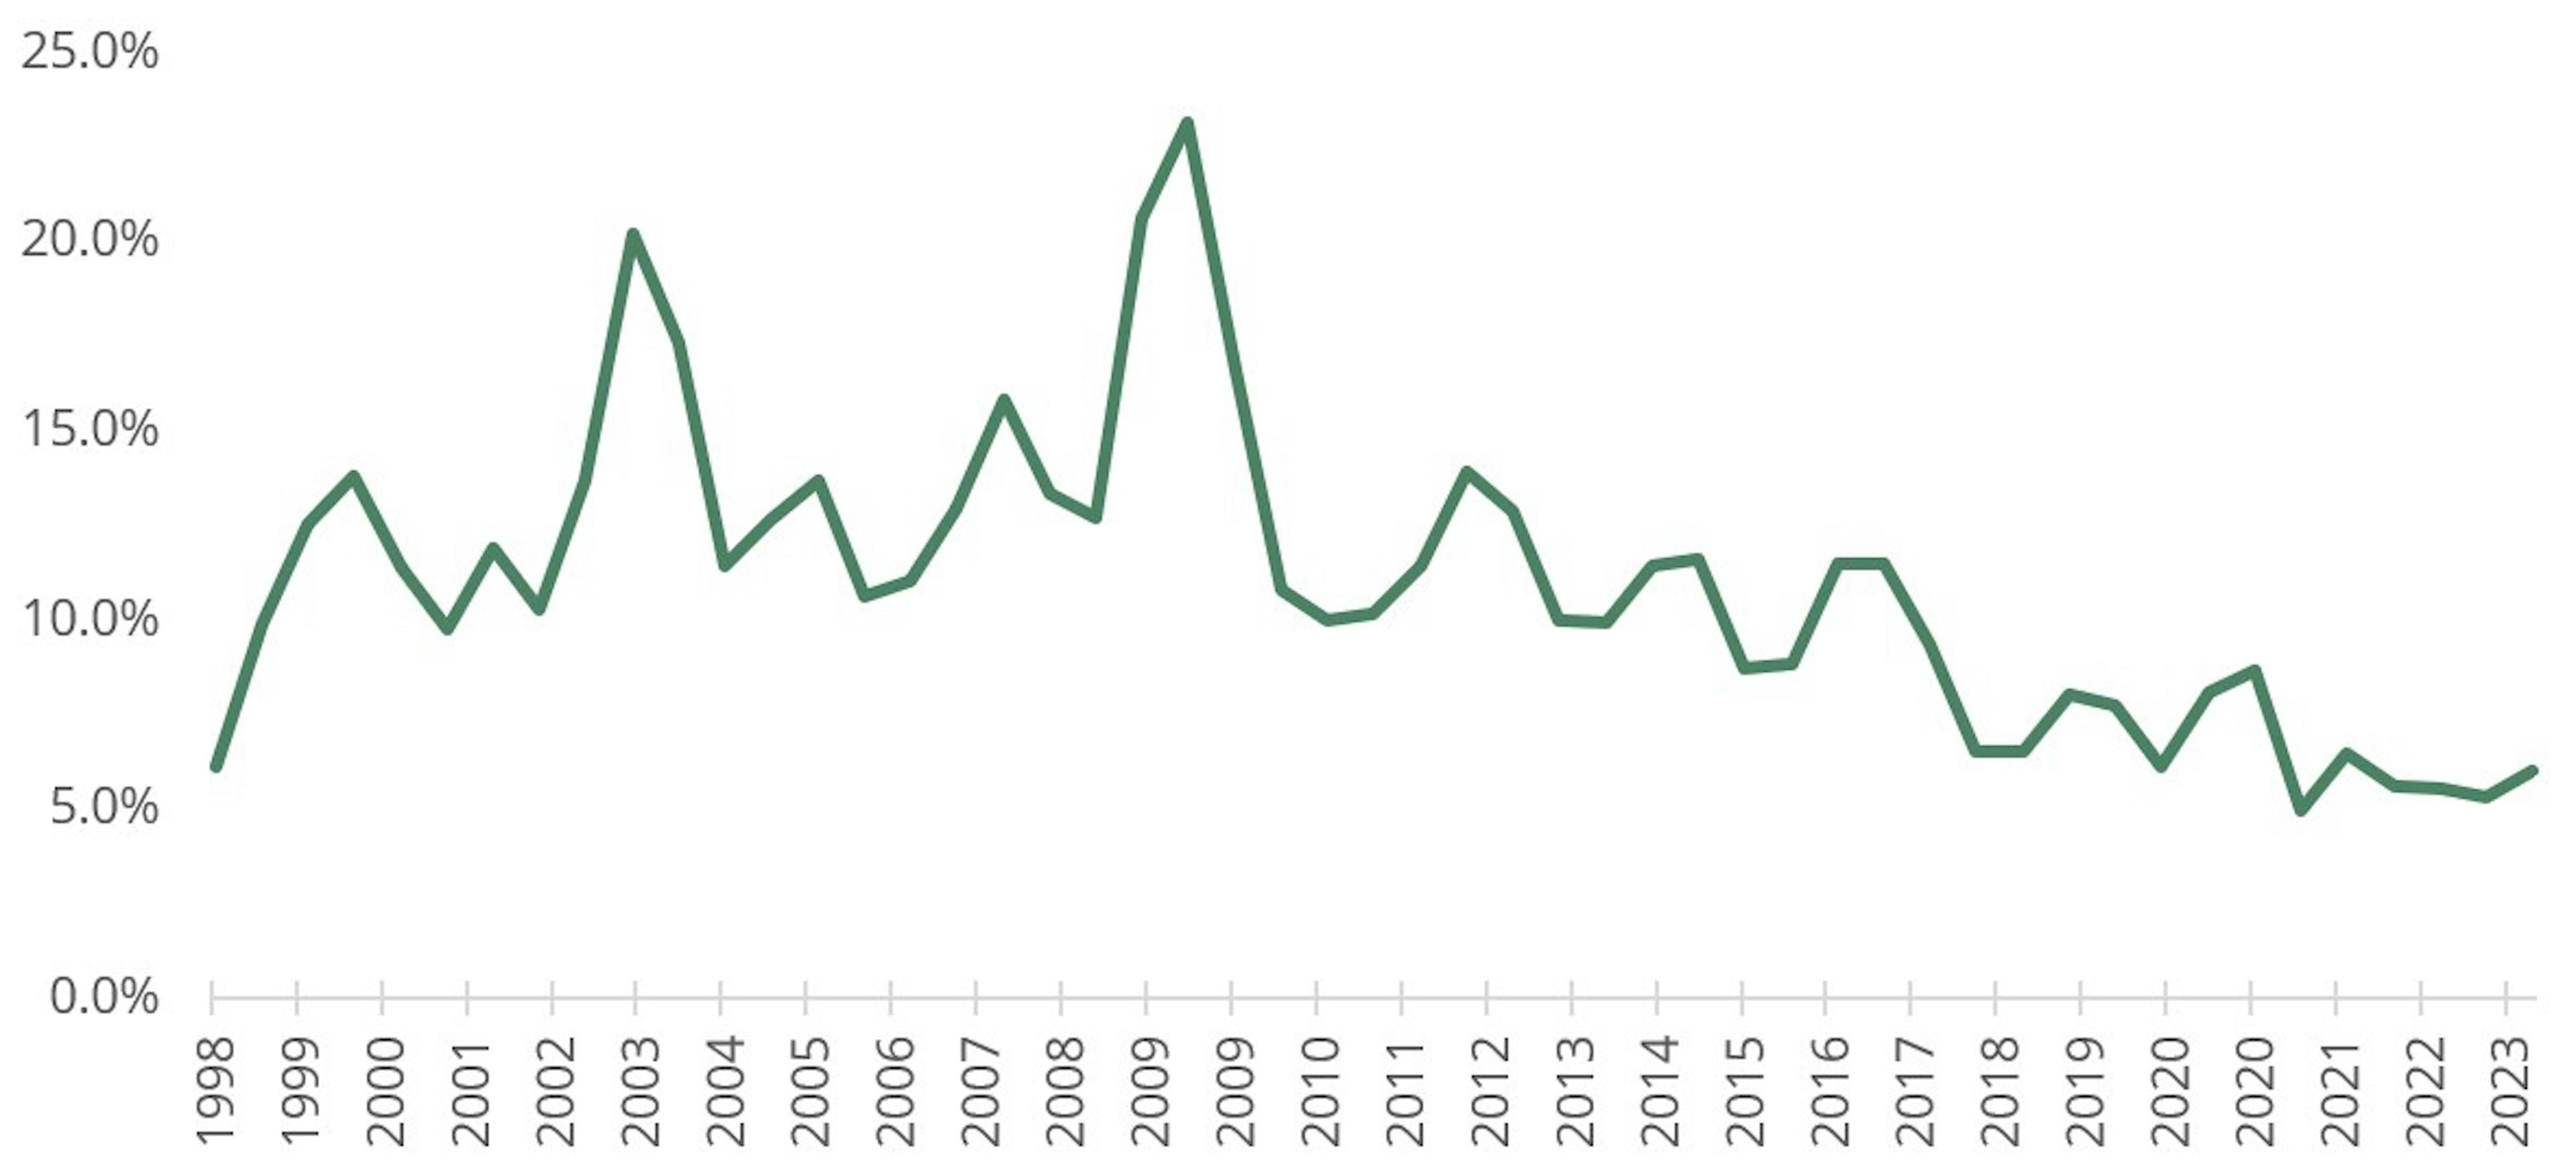
Although two deals in our portfolio were terminated in Q3, the overall deal failure rate in the US is at historically low levels, as shown in the following graph:
M&A deal failure rate in the US over the past 25 years
Source: Carmignac, 30/09/2023
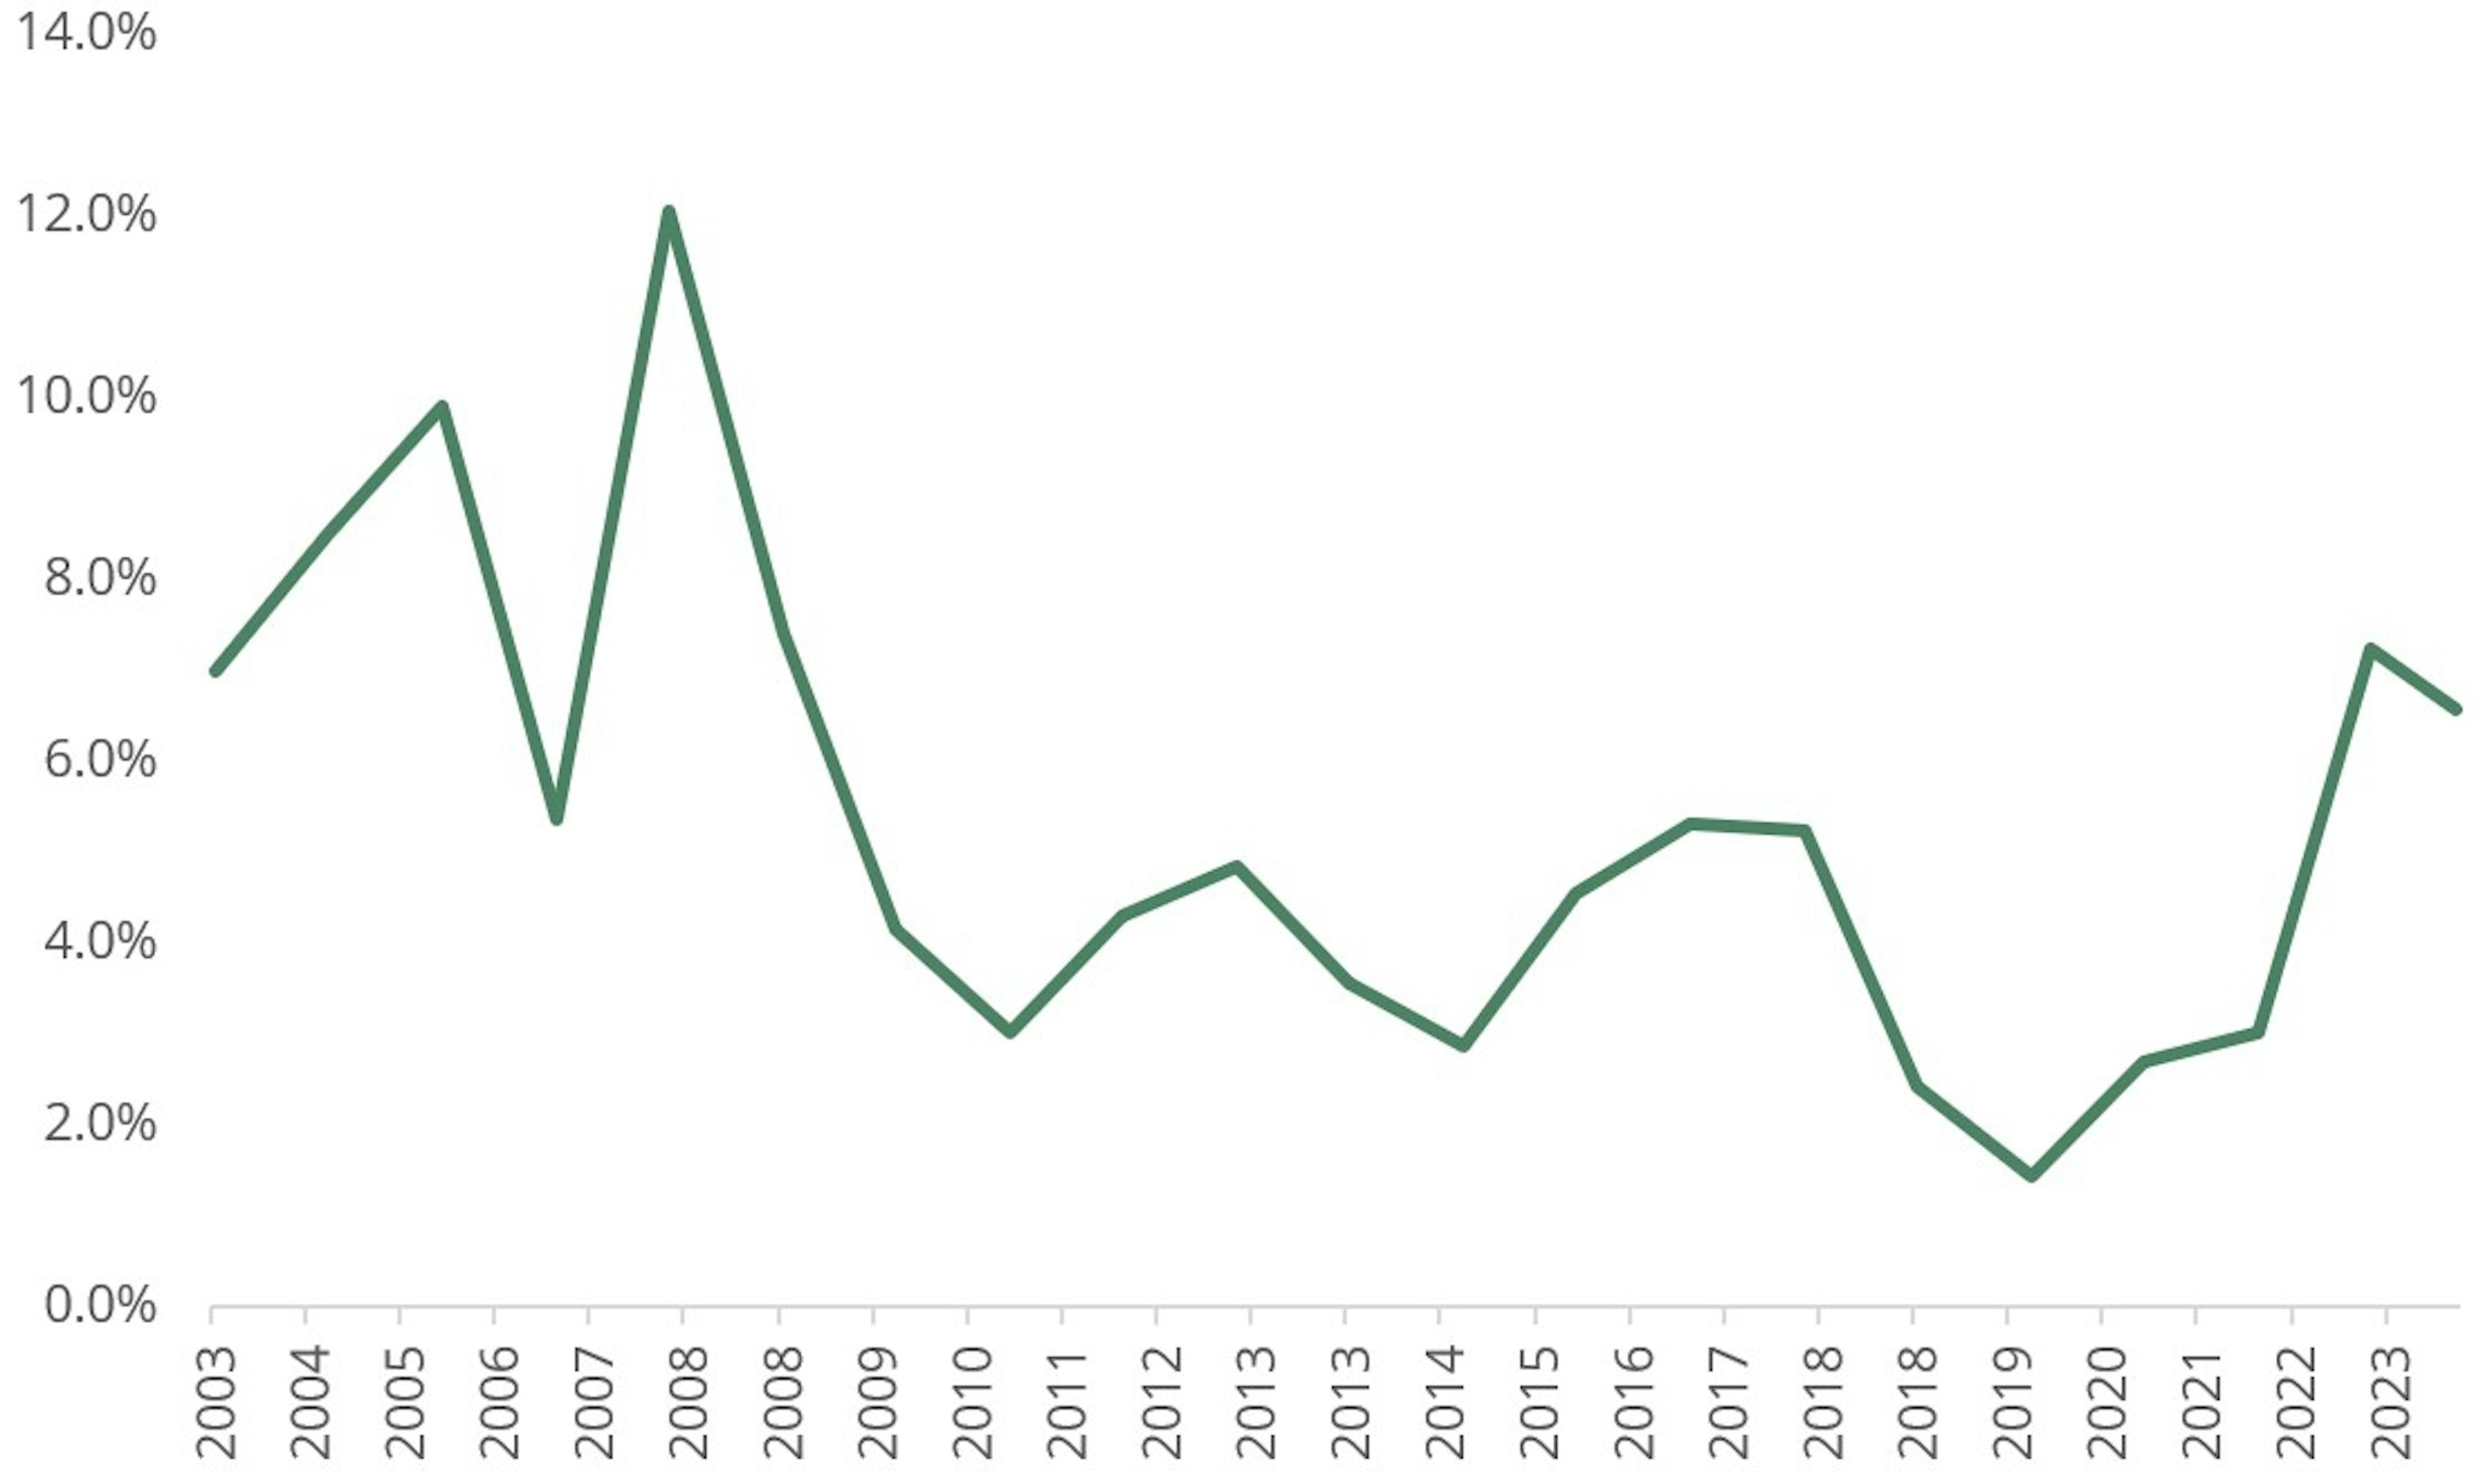
What’s more, merger arbitrage spreads ended Q3 at comfortable levels after getting a boost from the increase in both interest rates and risk premiums starting in 2021, as indicated below:
Average merger arbitrage spreads in the US
Source: Goldman Sachs, 30/09/2023
In short, we’re highly confident that the M&A climate in the coming quarters will give us numerous opportunities to generate alpha for our investors.
Have a great fall.

Carmignac Portfolio Merger Arbitrage Plus
Carmignac Portfolio Merger Arbitrage Plus I EUR Acc
- Recommended minimum investment horizon
- 3 years
- Risk indicator*
- 2/7
- SFDR - Fund Classification**
- Article 8
*Risk Scale from the KID (Key Information Document). Risk 1 does not mean a risk-free investment. This indicator may change over time. **Sustainable Finance Disclosure Regulation (SFDR) 2019/2088. The SFDR classification of the Funds may change over time.
Main risks of the fund
Fees
- Entry costs
- We do not charge an entry fee.
- Exit costs
- We do not charge an exit fee for this product.
- Management fees and other administrative or operating costs
- 1,12 % of the value of your investment per year. This estimate is based on actual costs over the past year.
- Performance fees
- 20,00 % max. of the outperformance if the performance is positive and the net asset value exceeds the high-water mark. The actual amount will vary depending on how well your investment performs. The aggregated cost estimation above includes the average over the last 5 years, or since the product creation if it is less than 5 years.
- Transaction Cost
- 0,23 % of the value of your investment per year. This is an estimate of the costs incurred when we buy and sell the investments underlying the product. The actual amount varies depending on the quantity we buy and sell.
Performance
| Carmignac Portfolio Merger Arbitrage Plus | +2,3 | +4,6 | +3,7 | +3,2 |
| Carmignac Portfolio Merger Arbitrage Plus | +3,0 % | +3,7 % | +3,9 % |
Source: Carmignac at Oct 30, 2026.
Date of 1st NAV : 14/04/2023.
Past performance is not necessarily indicative of future performance. Performances are net of fees (excluding possible entrance fees charged by the distributor). The Fund presents a risk of loss of capital.
The return may increase or decrease as a result of currency fluctuations, for the shares which are not currency-hedged.
Reference Indicator: -