
The New Asian Tigers

Following a recent research trip to Taiwan and South Korea, Naomi Waistell, Co-Manager of FP Carmignac Emerging Markets and Carmignac Portfolio Emergents, highlights the renewed strength and global relevance of Asia’s “New Tigers.”
Once known for their export-driven rise, these economies are now powering the digital and artificial intelligence (AI) revolutions that will shape the next decade. Yet, they remain under-owned, undervalued, and often overlooked by global investors.
Beneath the headlines dominated by a few large-cap names, she sees a deep and diverse investment landscape where structural growth, technological leadership, and improving governance converge. For those willing to look beyond the obvious, the opportunities in Asia are as diverse as they are compelling.
In the aftermath of World War II, Taiwan, South Korea, Hong Kong and Singapore experienced rapid, export-driven industrialization and economic growth, and were dubbed the ‘Asian Tiger’ economies. The transition from agricultural markets to high-value, knowledge-based economies able to compete globally, was swift and so imagery of the tiger in Asian symbolism captured this stealth-like speed, power and agility. Today, there is nothing camouflaged about the successful development of Hong Kong and Singapore which have become major international financial centres. Taiwan and South Korea, meanwhile, dominate the world in semiconductor manufacturing, with 100% share in the very leading-edge technology.
Smallest chip component in nanometers

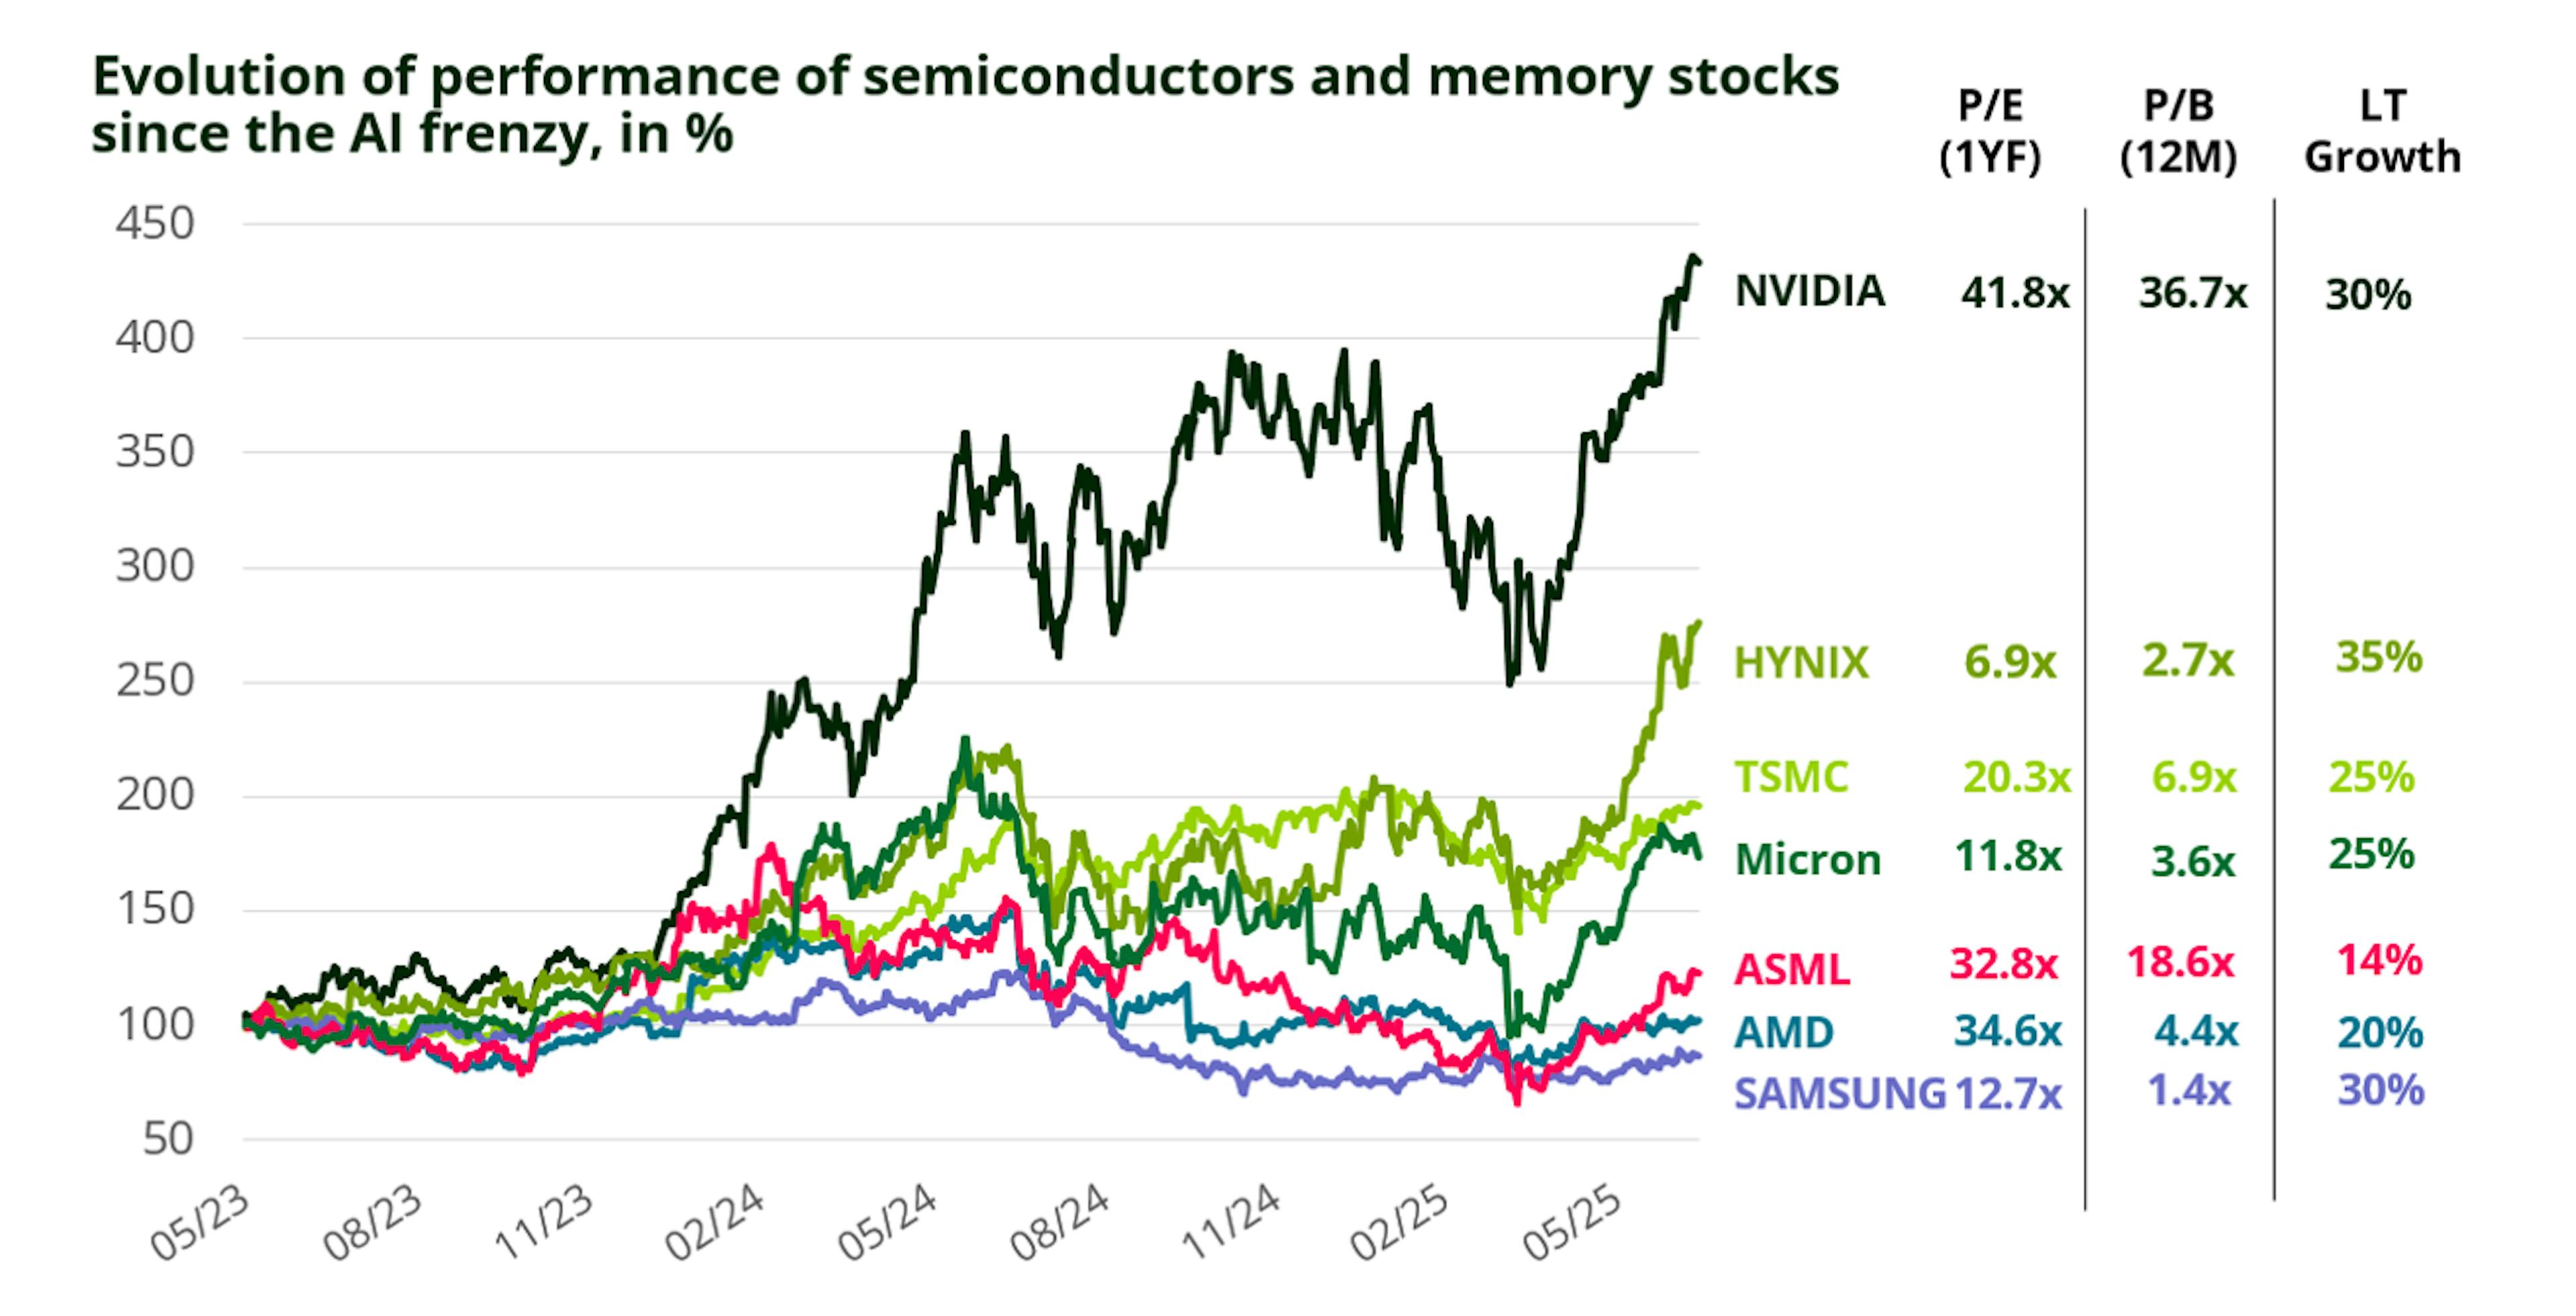
Yet, AI is currently almost uniquely framed as a Silicon Valley construct, neglecting the reality that the core infrastructure and fabrication would not be possible without North Asia. Simply put, it’s impossible to talk about AI, without talking about these emerging markets, here lie the critical enablers of the AI revolution. From advanced chip manufacturing in Taiwan to memory chips from South Korea and the plethora of niche but non-negotiable components that the world now cannot live without. There are some household names – TSMC of course – but what’s missed is the depth of this vital supply chain, the ‘picks and shovel’ companies which number into the hundreds and offer a rich seam of potential for stock-picking. Both Taiwan’s Taiex index and the Kospi index in South Korea have continued to climb to new all-time highs this year, yet attention is narrowly trained on just a few, large-cap companies and global funds remain perennially underweight to the region.

We see this as an inefficiency we’re able to use to our advantage, with a deeper knowledge and understanding of this ecosystem, its intricate nature, and an appreciation for the elusive advantages of experience, expertise, scale and a culture that is the cornerstone of success. With this in mind, we travelled to these Asian Tigers in September, meeting with ~30 semiconductor companies and hunting for lesser-spotted opportunities for active returns.
What we learnt was that the key bottleneck or constraints are often in specialized areas, controlled by one or two mid-sized companies – those who make indispensable BMCs (baseboard management controller), CCL (copper clad laminate), server racks, power systems or liquid cooling solutions. In some cases, prices for their essential parts are rising 2-3-fold and greater volumes are required for each generation, driving up growth whilst competitive advantages in cost and yield rate remain, thus improving profitability. One company we met with put this into context: ‘We make 10-year strategic plans. Last year we set the 10-year operating margin target at 15% [from 11.3% in 2024), and now we’re there!’ Hitting a ten-year margin target in less than a year, is unheard off, yet so is the pace of demand growth. Increasingly too, these component makers are seeing more diversified sources of demand, not only from the dominant GPU architecture, but increasingly from ASICs (application specific integrated circuits) which are likely to run more in parallel in the future and provide another avenue for growth, expanding the total addressable market and reducing the concentration risk of one key customer.
The overwhelming takeaway from time spent on the ground was a story of continued strength in demand across the AI chain, with no near-term indications of an air-pocket, or even any softness in demand between generations – customers want constant supply and utilization rates for many are running at 100% all year. One company we spoke with described how payments for shipments flown to the US are based on weight, which is only going up and up, but remarked ‘there is no limit to the demand, they want this stuff’. Management teams were unanimously optimistic about the long-term AI growth opportunity, with strategic challenges focused on how to resolve capacity constraints in certain areas, which for now only serve to boost pricing power. We see this as structural, given the long and arduous qualification cycles for key components, which elevate switching costs and entry barriers and lead to very sticky recurring revenue with lower risk.
Anecdotally, investor awareness of these markets is now starting to grow, and we met a number of senior global investors who were visiting Taiwan and Korea for the very first time. And why wouldn’t they? If Jensen Huang’s comments during the last Nvidia earnings call, that the global AI market could expand to $3-4trn in 2030, from $600bn currently, implying a >40% CAGR1, this will translate into vast incremental investments into Asia over the next 5 years, underscoring a very significant runway for growth in these critical enablers.
With concerns on geopolitical tensions becalmed – at least for now, valuations in Asia at a marked discount to those in the US and, in Korea, a parallel corporate governance reform story, we continue to see these markets as a ripe hunting ground for investment opportunities. Companies here have underappreciated levels of profitability, with healthy financial resources to support what is a compelling growth opportunity and continue to expand their earnings – which is ultimately, what drives stock prices. AI exposure needn’t be sought at stratospheric multiples; Asian companies offer diversification into a less-crowded yet arguably more attractive means of exposure.
Bloomberg consensus forward estimates for CY2025 and CY2026.
SK Hynix, despite rallying more than 150% (in US$ terms), year-to-date, still trades on a single digit forward P/E of just 6.9x, for 30%+ earnings growth – a very stark valuation anomaly. TSMC, whilst slightly more expensive, is still nowhere close to valuation levels of the developed market peers for whom its services are essential and almost without substitute. The same is true for a number of our mid-cap technology holdings2, which trade on mid-high teens PE multiples and often offer superior gross margin and ROIC profiles. As content per chip and per server unit continue to ramp up, we believe an increasing amount of the incremental industry profit pool will accrue to these efficient operators. Structural growth and profitability on sale at a discount! We see this as a compelling landscape for alpha generation.
TSMC – Absolutely FABulous
TSMC is, quite literally, the mother of all AI. AI-accelerator chips which train and run LLMs (large language models) are the backbone of this transformational technology, and almost all of these are made by TSMC, and mostly in Taiwan. Explosive demand for these chips has seen TSMC’s revenue double over the last four years, with revenue from AI growing multi-fold and accounting for an increasing share. The company aims to continue growing at 20% CAGR through to the end of the decade, and to deliver on this TSMC is spending an estimated $40bn in capex this year and has announced significant multi-year investment projects to expand capacity, including $165bn to be spent in Arizona, deepening its US footprint. The focus of the spending will be on the high-end nodes, 2nm and 3nm capacity which are vital for high performance compute and power efficiency in AI chips.
TSMC was founded by Morris Chang in 1987, at a time when most chip fabrication was done ‘in house’ by the chip design companies. TSMC set out to show that a dedicated, specialised chip manufacturing firm could streamline and advance processes and offer efficiencies for all. Instead of fabrication operating under an ‘each man for himself’ model, TSMC worked for multiple customers, bringing economies of scale and the trust that, as a pure manufacturer, they will never compete with customers but instead allow them to operate as capital light, ‘fabless’ design houses. This transformed the industry structure and has seen the number of players able to offer leading-edge manufacturing capabilities crater from 26 in 2002 to just 2-3 today: TSMC, Samsung and Intel.

*Moore‘s Law states that the number of transistors in an integrated circuit chips doubles every 2 years.
TSMC has 90% share in the advanced nodes, as Samsung and Intel’s foundries have struggled to produce 5nm and below chips with scale and yields to rival TSMC’s abilities. We therefore do not see recent moves from Nvidia and the US government to partner with and inject capital into Intel as a significant threat. What they are doing is now at a level of precision that is simply very, very hard to replicate. Nvidia will continue to rely heavily on TSMC for the foreseeable future. During our meeting with the company at its sprawling headquarters outside Taipei, the company reaffirmed their schedule to begin mass production of 2nm chips in Taiwan later this year.
Maintaining this position of unrivalled leadership is not cheap, their ~$40bn 2025 capex dwarfs the spend of Samsung, who’s foundry capex is just $4bn this year, whilst Intel’s stands at ~$10bn. TSMC is spending where it counts most: in the advanced nodes, with 5nm and below revenues now accounting for 50% of revenue and expected to reach 70% of revenue by 2027, solidifying their dominance.

The company confirmed to us that demand for these leading-edge nodes continues to be greater than supply and will continue to grow, with interest in 2nm higher than that of 5nm and 3nm and setting the conditions for 2nm set to be a longer, larger and ultimately more successful node both in terms of revenue and profitability. Management discussed with us their 5-year framework which uses external inputs and internal analysis to determine an appropriate long-term demand profile. With more than 500 customers they have the deepest, widest view of industry dynamics and as tech complexity increases, customers are having to plan 3 years ahead, helping with visibility. TSMC has been using this detailed, bottom-up framework for some time, and backtests show it to be good at tracking trends. So, whilst short-term pauses are always possible, everything they see from their unique vantage point indicates continued strong momentum for AI (both GPU and ASIC). TSMC is working hard to catch up with the demand, including accelerating the build of fabs, but the reality is, they take time!

TSMC’s share price has soared almost 200% since the advent of ChatGPT at the end of November 2022, making it now the world’s 9th most valuable company, ahead of Tesla. The unrelenting pursuit of excellence and efficiency has led to gross margins few could dream of, close to 60%4. Management attribute their margins to six key factors: their technology and leadership, utilisation rates, cost, mix, FX and pricing. And yes, given their critical nature and dominance they could push pricing higher, but the company’s mantra has always been that they succeed when customers also succeed and so they are mindful to share the fruits of their innovation. They believe in the need to ‘earn our value’ via continued technology difference and recognise the requirement to earn a healthy and sustainable return – ROE is currently 30%5 and they see a level >25% as ‘non-negotiable’.
TSMC’s biggest challenge is likely what is also its biggest asset: the culture. Famed for an intensive work-ethic, with expert employees who ceaselessly seek marginal improvements, it will be very difficult to replicate in the US. But the company does acknowledge the imperative to diversify away from their home island, even aside from geopolitical wranglings. Considerations of land, engineer and power availability are all increasingly pressing, with some estimates stating that TSMC could account for 25% of Taiwan’s electricity consumption by 2030 (from <10% today)6. The ability for them to achieve this future growth will depend increasingly on success overseas.
TSMC still has far-reaching growth ambitions beyond the current opportunity set, into a future featuring enterprise AI and physical AI, self-driving cars and humanoid robots which will all become very much a reality as model capabilities continue to increase, leading to an ever-growing market for the manufacturing behemoth. It is a truly unique company, the clearest beneficiary of the compute super-cycle and an absolutely core holding for exposure to the AI revolution.
The un-sung supply chain
The opportunities for Asia within this AI revolution, however, span far beyond TSMC alone. In our portfolio we have experienced strong returns from diversifying our reliance on TSMC (now close to 12% of the benchmark and impossible to overweight), into a range of niche, mid-cap players across the value chain. Often these are the only player in a given area, or at least the undisputed leader of an essential hardware component, rendering them resilient, with structural advantages in cost structure and pricing power, and providing the opportunity for higher alpha. Here we highlight two such, less discovered, end markets.
Copper Clad Laminate (CCL)
Copper clad laminate is a key material used in making PCBs (printed circuit boards), allowing for the mounting of semiconductor components onto the PCB. As the numbers of GPUs continue to multiply, there will be an ongoing increase in the content of PCB/CCL in each server compute tray, with forecasts suggesting that the value of these components per compute tray will expand 3-fold with the transition from the current Nvidia Blackwell to the Nvidia Rubin architecture, driving high growth for CCL makers.
Booming demand has led to very tight supply in CCL (owing to shortages in key materials such as glass fibre), causing hesitancy in expanding capacity and thereby compounding the supply constraint and conferring greater advantage to those with sufficient raw materials and capacity. CCL prices have moved up more rapidly due to this dynamic and look supportive of continued strong growth and robust profit margins. Longer-term, players able to continually to upgrade their CCL technology and operate at the high-end should maintain a premium.

Liquid Cooling
Our trip highlighted the growing challenges of thermal management within AI systems. As the compute content grows, so too does power consumption and therefore the need to deploy solutions to effectively cool ever-hotter systems is becoming an increasing area of focus for the industry. The content value of thermal dissipation components in air-cooling for AI servers has increased 18x vs. conventional servers, and more effective, liquid-cooling solutions could see a further 3-6x content value upgrade, driving both revenue and margin expansion. One company we met with commented they had ‘never seen a business grow like this’.
New technologies are emerging in this space, most notably ‘microchannel lids’ with superior heat transfer and cooling efficiency, which we see as exciting opportunity for further value capture, though timescales for adoption are still uncertain and it’s likely that those with existing expertise, working directly with major customers will retain their advantages.

SK Hynix: The Memory Maker
SK Hynix too is at the epicentre of the AI boom, thanks to the company’s technology leadership in the high bandwidth memory (HBM) needed for advanced AI chips and their dominant market share with major customers, notably Nvidia, which has been core to our view. We spent time with the management in Korea as well as with peers and supply chain players to ensure this thesis remains intact.
Focus is squarely on pricing negotiations with Nvidia for next generation HBM4 contracts that will shape profitability from 2026 onwards. The protractive nature of these talks suggests tough bargaining terms on both sides and perhaps too Nvidia’s uncertainty over Samsung’s readiness as a second source. Regardless of this outcome, we feel confident that Hynix will maintain dominant market share in HBM for the foreseeable future. Although Samsung’s new 1c technology could offer power efficiency advantages, the proven reliability of Hynix will continue to deliver unmatched yields and lower failure rates, key determinants of cost efficiency, where experience, scale, and yield management matter more. Additionally, Hynix is reportedly poised to gain share with hyperscalers such as Google and Amazon, pending the Nvidia outcome.
Though costs for HBM4 are thought to have risen 30–50% versus the previous generation, Hynix is keen to stress that its cost base remains far below selling prices. Even a modest price rise could preserve solid margins, which is a core focus. We welcome this discipline, which is also evident in capacity management, where the company stated they are building only against secured demand, rejecting the ‘build it and they will come’ mindset that once destabilised DRAM cycles. Management aims for stability and profitability over scale, reinforcing a culture shaped by the lessons of past overexpansion.


As HBM4 becomes dominant from the second half of 2026, previous generation HBM3e pricing will naturally decline. However, we do not ascribe to the fears of deep HBM margin erosion that some have expressed. Instead, we are optimistic that AI-driven demand is absorbing supply, while conventional DRAM has entered what management referred to as a ‘stealth upturn’, providing an additional source of growth, as industry supply is constrained by reallocation toward HBM, while the demand outlook remains firm. Even the NAND market has now moved into positive territory as inventories normalise, pointing to a structural upturn in NAND pricing and profitability, with capital allocation now targeting sustainable returns on investment. We see sustainable earnings growth and an extended positive memory cycle.


SK Hynix’s dual exposure to HBM leadership and DRAM/NAND recovery positions it uniquely. Valuations have rebounded recently due to headlines surrounding Sam Altman’s visit to Korea during which he announced a strategic partnership for OpenAI with both SK Hynix and Samsung Electronics to supply HBM to the Stargate project. The volumes spoken about in this deal represent more than 100% of the current capacity of the whole memory industry! So, whilst we see this primarily as fuel to an already hot AI market, and take it with a large pinch of salt, it does underscore the importance of memory supply in AI infrastructure, and represents a huge additional growth opportunity, which would further tighten industry supply.
Whilst the outcome of the HBM4 talks with Nvidia may set the tone in the short term, we retain our conviction that the combination of technology leadership, resilient AI demand and a strong balance sheet all at just 6.9x 2026 P/E7, support further re-rating potential.
Time for Korea to ‘Value Up’
Korea’s Value-up corporate governance reform story adds a secular driver to the Korean equity market, which has long traded with a so-called ‘Korea discount’, and despite rocketing up more than 60% this year, Korean equities still trade far below other Asian counterparts. Persistent low valuations have long constrained domestic wealth creation, encouraged capital flight, and elevated the cost of equity for new ventures. The ongoing reforms aim to reverse this cycle by fostering disciplined capital management, equitable governance, and stronger shareholder engagement. If implemented successfully, this reform could mark a pivotal juncture in South Korea’s economic and market evolution.

The Presidential election in June of this year has given new impetus to long-delayed governance reforms. Within the last few months, multiple Commercial Act revisions have been enacted, dramatically enhancing boards’ fiduciary duties to all shareholders. Key achievements include: making board members more accountable to all shareholders, not just controlling ones; a minimum one-third independent director requirement for large-cap firms; the introduction of mandatory cumulative voting and strengthened audit committee independence. There is more to come, with changes to onerous dividend taxation expected, though the perceived ‘holy grail’ of inheritance tax cuts (which would encourage value release across the often complex cross-shareholding structures of chaebols) remains improbable.
There is a broader vision for the these reforms too, beyond a market rally. The new, unified, government under President Lee seeks to use capital market reform as a tool for reducing inequality in Korea: promoting financial market participation as a means of rebalancing wealth creation towards more productive financial assets and reducing Korea’s dependence on real estate — which still represents 64% of household assets. There is now a convergence of governance reform, political stability, and shifting social attitudes toward wealth which is supportive of the need to redress stark social imbalances. With Korean demographics among the very worst globally and wealth concentrated in the hands of very few, there is a necessity to broaden the distribution of and sources of wealth to aid with the pension obligations of a rapidly aging population.
Encouragingly, there are tangible signs that corporate Korea is responding, this was both felt qualitatively from our engagement with corporates on the ground and can be seen quantitatively through the rapid ascent in share buybacks (up 80% yoy) and cancellations over the last two years, with treasury share cancellations leaping from 4.5trn KRW in 2023 to close to 18trn year to date in 2025!


Most management teams we spoke with understood the need to shift towards more shareholder friendly capital allocation and we felt reassured during the trip that the government and regulators are committed to keeping the pressure on improving corporate governance standards. Many investors, however, remain sceptical, meaning that despite the year-to-date move, valuations are only just back to long-term averages and not yet pricing in a real structural re-rating for this market. If governance norms converge further to global standards there could still be material upside. The long-term vision is clear: a self-reinforcing virtuous cycle where higher shareholder returns attract domestic participation, increase capital efficiency, and lower the cost of equity for innovation. Such a cycle could transform Korea’s markets from chronically undervalued to dynamically self-sustaining. However, significant, obstacles remain unresolved, in the form of entrenched ownership structures and opaque related-party transactions, so the path to President Lee’s once unimaginable ‘Kospi 5000’ target may not be impossible, but it’s likely to be uneven. But, at a time when other markets are close to record valuations, Korea relative valuation remains at a substantial discount and foreign ownership levels are little changed. Couple this with the drivers from AI, K-culture, and other industrials and we believe there is further to go.

Final Thoughts
Away from the AI opportunities and the corporate governance reform stories, the further positive for both Taiwan and Korea is their improving macro dynamics. Taiwan’s GDP grew 8% in 2Q25 – the fastest rate for four years, leading the government to upgrade the full year forecast to 4.45%8. The same can’t yet be said for Korea’s GDP, but with debt-levels low and a more fiscally expansionist government in place there is room to provide a boost.
Housing affordability in Korea has now normalised, and with the majority of household assets in property, removing the negative wealth effect of falling property prices has provided an essential fillip to sentiment and consumption. Both economies have, unsurprisingly, seen their exports (particularly semi-related exports) boom, whilst their currencies have also performed strongly this year. Interest rates in Taiwan are at 2.5% and the Bank of Korea recently cut 50bps to 2.5%.
This creates a robust backdrop for corporate earnings growth, which notably, in both Korea and Taiwan is at the highest levels relative to long-term averages compared to all other major Asian and emerging markets.

Despite this, these Asian Tigers continue to remain off many global investors’ radar, and structurally under-owned, even though they house many of the world’s fastest growing and most profitable companies. This displays poor recognition of the critical role emerging markets play in making AI a reality, but happily it advantages those willing to look beyond just the large-caps in the limelight, in the pursuit of alpha generation.
Diversifying our exposure via lesser-known stock picks has not only helped us to deliver enhanced returns versus the reference indicator9, but also spread our risk across varied parts of the technology value chain ensuring we consider the full scope context of investment opportunities. In Taiwan and Korea the investment landscape is far broader and more varied than many presume.
As the K-Pop Demon Hunter ‘Tonic Man’ puts it:
“Focus is good, but focusing on one part leads to ignoring other parts, making you separated, isolated.”
We tend to agree, and encourage investors to look again at the New Asian Tigers – they don’t bite!
Source: Carmignac, Bloomberg, Company data, 30/10/2025. Trademarks and logos do not imply affiliation or endorsement. Reference to certain securities and financial instruments is for illustrative purposes to highlight stocks that are or have been included in the portfolios of funds in the Carmignac range. Carmignac portfolios are subject to change without notice. Past performance is not necessarily indicative of future performance. The return may increase or decrease as a result of currency fluctuations.
1CAGR: Compound Annual Growth Rate.
2Holdings in Carmignac Portfolio Emergents and FP Carmignac Emerging Markets, as of 30/09/2025.
3
4Source: Bloomberg, company data, September 2025.
5Source: Bloomberg, company data, Goldman Sachs, BoAML Research, September 2025.
6Source: Bloomberg, company data, September 2025.
72026 P/E (price earning) ratio, Bloomberg, 15/10/2025.
8Source: IMF World Economic Outlook, September 2025.
92025 year to date as of 30/09/2025 and over 3 and 5 years.
Carmignac Portfolio Emergents FW GBP Acc
- Recommended minimum investment horizon
- 5 years
- Risk indicator*
- 6/7
- SFDR - Fund Classification**
- Article 9
*Risk Scale from the KIID (Key Investor Information Document). Risk 1 does not mean a risk-free investment. This indicator may change over time. **The Sustainable Finance Disclosure Regulation (SFDR) 2019/2088 is a European regulation that requires asset managers to classify their funds as either 'Article 8' funds, which promote environmental and social characteristics, 'Article 9' funds, which make sustainable investments with measurable objectives, or 'Article 6' funds, which do not necessarily have a sustainability objective. For more information please refer to https://eur-lex.europa.eu/eli/reg/2019/2088/oj.
Main risks of the fund
Fees
- Maximum subscription fees paid to distributors
- 0.00%
- Redemption Fees
- 0.00%
- Conversion Fee
- -
- Ongoing Charges
- 1.35%
- Management Fees
- 1.05% MAX
- Performance Fees
- -
Footnote
Performance
| Carmignac Portfolio Emergents | 17.8 | 24.6 | -17.3 | 19.8 | 65.9 | -15.8 | -9.4 | 8.0 | 0.5 | 23.8 |
| Reference Indicator | 32.6 | 25.4 | -9.3 | 13.9 | 14.7 | -1.6 | -10.0 | 3.6 | 9.4 | 18.6 |
| Carmignac Portfolio Emergents | + 11.5 % | + 5.2 % | + 9.9 % |
| Reference Indicator | + 11.0 % | + 6.2 % | + 9.3 % |
Source: Carmignac at 30 Sep 2025.
Past performance is not necessarily indicative of future performance. Performances are net of fees (excluding possible entrance fees charged by the distributor).
Reference Indicator: MSCI EM (GBP) (Reinvested net dividends)
FP Carmignac Emerging Markets A GBP ACC
- Recommended minimum investment horizon
- 5 years
- Risk indicator*
- 6/7
- SFDR - Fund Classification
- Article -
*Risk Scale from the KIID (Key Investor Information Document). Risk 1 does not mean a risk-free investment. This indicator may change over time.
Main risks of the fund
Fees
- Maximum subscription fees paid to distributors
- 0.00%
- Redemption Fees
- 0.00%
- Conversion Fee
- -
- Ongoing Charges
- 0.95%
- Management Fees
- 0.87% MAX
- Performance Fees
- -
Footnote
Performance
| FP Carmignac Emerging Markets | 13.6 | 63.0 | -15.6 | -9.5 | 7.2 | 0.9 | 22.6 |
| Reference Indicator | 8.8 | 14.7 | -1.6 | -10.0 | 3.6 | 9.4 | 18.6 |
| FP Carmignac Emerging Markets | + 11.0 % | + 5.0 % | + 10.4 % |
| Reference Indicator | + 11.0 % | + 6.2 % | + 6.4 % |
Source: Carmignac at 30 Sep 2025.
Past performance is not necessarily indicative of future performance. Performances are net of fees (excluding possible entrance fees charged by the distributor).
Reference Indicator: MSCI EM NR index
Articles that may interest you

FP Carmignac Emerging Markets: Letter from the Fund Managers - Q3 2025
FP Carmignac Emerging Markets: Letter from the Fund Managers - Q2 2025

Marketing communication. Please refer to the KID/KIID, prospectus of the fund before making any final investment decisions. This document is intended for professional clients.
This material may not be reproduced, in whole or in part, without prior authorisation from the Management Company. This material does not constitute a subscription offer, nor does it constitute investment advice. This material is not intended to provide, and should not be relied on for, accounting, legal or tax advice. This material has been provided to you for informational purposes only and may not be relied upon by you in evaluating the merits of investing in any securities or interests referred to herein or for any other purposes. The information contained in this material may be partial information and may be modified without prior notice. They are expressed as of the date of writing and are derived from proprietary and non-proprietary sources deemed by Carmignac to be reliable, are not necessarily all-inclusive and are not guaranteed as to accuracy. As such, no warranty of accuracy or reliability is given and no responsibility arising in any other way for errors and omissions (including responsibility to any person by reason of negligence) is accepted by Carmignac, its officers, employees or agents.
Past performance is not necessarily indicative of future performance. Performances are net of fees (excluding possible entrance fees charged by the distributor). The return may increase or decrease as a result of currency fluctuations, for the shares which are not currency-hedged.
Reference to certain securities and financial instruments is for illustrative purposes to highlight stocks that are or have been included in the portfolios of funds in the Carmignac range. This is not intended to promote direct investment in those instruments, nor does it constitute investment advice. The Management Company is not subject to prohibition on trading in these instruments prior to issuing any communication. The portfolios of Carmignac funds may change without previous notice. The reference to a ranking or prize, is no guarantee of the future results of the UCIS or the manager.
Morningstar Rating™ : © Morningstar, Inc. All Rights Reserved. The information contained herein: is proprietary to Morningstar and/or its content providers; may not be copied or distributed; and is not warranted to be accurate, complete or timely. Neither Morningstar nor its content providers are responsible for any damages or losses arising from any use of this information.
Access to the Funds may be subject to restrictions regarding certain persons or countries. This material is not directed to any person in any jurisdiction where (by reason of that person’s nationality, residence or otherwise) the material or availability of this material is prohibited. Persons in respect of whom such prohibitions apply must not access this material. Taxation depends on the situation of the individual. The Funds are not registered for retail distribution in Asia, in Japan, in North America, nor are they registered in South America. Carmignac Funds are registered in Singapore as restricted foreign scheme (for professional clients only). The Funds have not been registered under the US Securities Act of 1933. The Funds may not be offered or sold, directly or indirectly, for the benefit or on behalf of a «U.S. person», according to the definition of the US Regulation S and FATCA.
The risks, fees and ongoing charges are described in the KID (Key Information Document). The KID must be made available to the subscriber prior to subscription. The subscriber must read the KID. Investors may lose some or all their capital, as the capital in the funds are not guaranteed. The Funds present a risk of loss of capital.
The Funds’ prospectus, KIDs, NAVs and annual reports are available at www.carmignac.com/en, or upon request to the Management Carmignac Portfolio refers to the sub-funds of Carmignac Portfolio SICAV, an investment company under Luxembourg law, conforming to the UCITS Directive. The French investment funds (fonds communs de placement or FCP) are common funds in contractual form conforming to the UCITS or AIFM Directive under French law.
In the United Kingdom: the Funds’ respective prospectuses, KIIDs and annual reports are available at www.carmignac.com/en-gb, or upon request to the Management Company, or for the French Funds, at the offices of the acilities Agent, Carmignac UK Ltd, 2 Carlton House Terrace, London, SW1Y 5AF. This document was prepared by Carmignac Gestion, Carmignac Gestion Luxembourg or Carmignac UK Ltd. FP Carmignac ICVC (the “Company”) is an Investment Company with variable capital incorporated in England and Wales under registered number 839620 and is authorised by the FCA with effect from 4 April 2019 and launched on 15 May 2019. FundRock Partners Limited is the Authorised Corporate Director (the “ACD”) of the Company and is authorised and regulated by the FCA. Registered Office: Hamilton Centre, Rodney Way, Chelmsford, Essex, CM1 3BY, UK; Registered in England and Wales with number 4162989. Carmignac Gestion Luxembourg SA has been appointed as the Investment Manager and distributor in respect of the Company. Carmignac UK Ltd (Registered in England and Wales with number 14162894) has been appointed as a sub-Investment Manager of the Company and is authorised and regulated by the Financial Conduct Authority with FRN:984288.
In Switzerland: the prospectus, KIDs and annual report are available at www.carmignac.com/en-ch, or through our representative in Switzerland, CACEIS (Switzerland), S.A., Route de Signy 35, CH-1260 Nyon. The paying agent is CACEIS Bank, Montrouge, Nyon Branch / Switzerland, Route de Signy 35, 1260 Nyon.
The Management Company can cease promotion in your country anytime. Investors have access to a summary of their rights in English on the following links: UK ; Switzerland ; France ; Luxembourg ; Sweden.
For Carmignac Portfolio Long-Short European Equities: Carmignac Gestion Luxembourg SA in its capacity as the Management Company for Carmignac Portfolio, has delegated the investment management of this Sub-Fund to White Creek Capital LLP (Registered in England and Wales with number OCC447169) from 2nd May 2024. White Creek Capital LLP is authorised and regulated by the Financial Conduct Authority with FRN : 998349.
Carmignac Private Evergreen refers to the Private Evergreen sub-fund of the SICAV Carmignac S.A. SICAV – PART II UCI, registered with the Luxembourg RCS under number B285278.