
Southeast Asia: A powerhouse in the making
South East (SE) Asia is one of the most exciting regions for investors in the emerging markets universe, with many companies offering attractive and compounding multi-year growth prospects. From Indonesia’s digital economy to Vietnam’s IT services hubs, SE Asia offers opportunities across a broad range of sectors, with hungry entrepreneurs and unique business models.
Revisiting the SE Asia case
With a combined population of over 4.8 billion people, Asia is by far the most populated region on the planet. Even after the 2.8 billion combined population of India and China, SE Asia is still home to a further 700 million people and the continuing demographic trends will continue to drive growth in the region for decades to come.
From a corporate perspective, SE Asia represents currently:
Beyond its size, SE Asia is also emerging as a dynamic economic powerhouse thanks to its robust macroeconomic fundamentals and growth potential. Investors who once saw the region as a proxy for commodities are now discovering its richness in diverse sectors, underpinned by strong economic indicators. Indeed, SE Asian countries posted a GDP growth of 4.6% in 2024, compared with a 1.8% growth for advanced economies according to IMF data2.
Economically, the region continues to move from strength to strength. Many SE Asian countries have in the past decade followed orthodox fiscal policies, reducing deficits, and limiting currency depreciation, successfully addressing their vulnerabilities to produce a favourable investment environment.
From a bottom-up perspective, SE Asia offers fertile ground for stock picking. Many sectors remain underpenetrated, providing room for companies to grow faster than the broader economy. The standout companies in each sector also offer compounding growth, making for compelling long-term investment opportunities for diligent stock pickers like Carmignac.
Indonesia: Sparkling gem of the ASEAN region
As SE Asia’s largest economy, Indonesia has navigated global challenges including trade wars and the pandemic with impressive resilience. Key factors – a young workforce, abundant natural resources, particularly as the largest producer of energy-transition-critical nickel – and fiscal discipline have transformed Indonesia into a robust growth story.
The country’s recent economic achievements are particularly compelling. Inflation has eased significantly since the global 2021-2022 shocks, falling to near-record lows (CPI Inflation standing at 0.8% as of end of January 20256), enabling Bank Indonesia to begin its easing cycle, which should support the Indonesian equity markets going forwards.
Reforms supporting digitisation and future-focused sectors including electric vehicle battery production have further cemented Indonesia’s role in the global economy, in line with emerging mega-trends. Meanwhile, on the political side, following the presidential election last year, there seems to be a smooth transition between the former president Jokowi and the General Prabowo Subianto, bringing some political stability to the country. With the new government’s pro-growth agenda, prospects look solid in Indonesia.
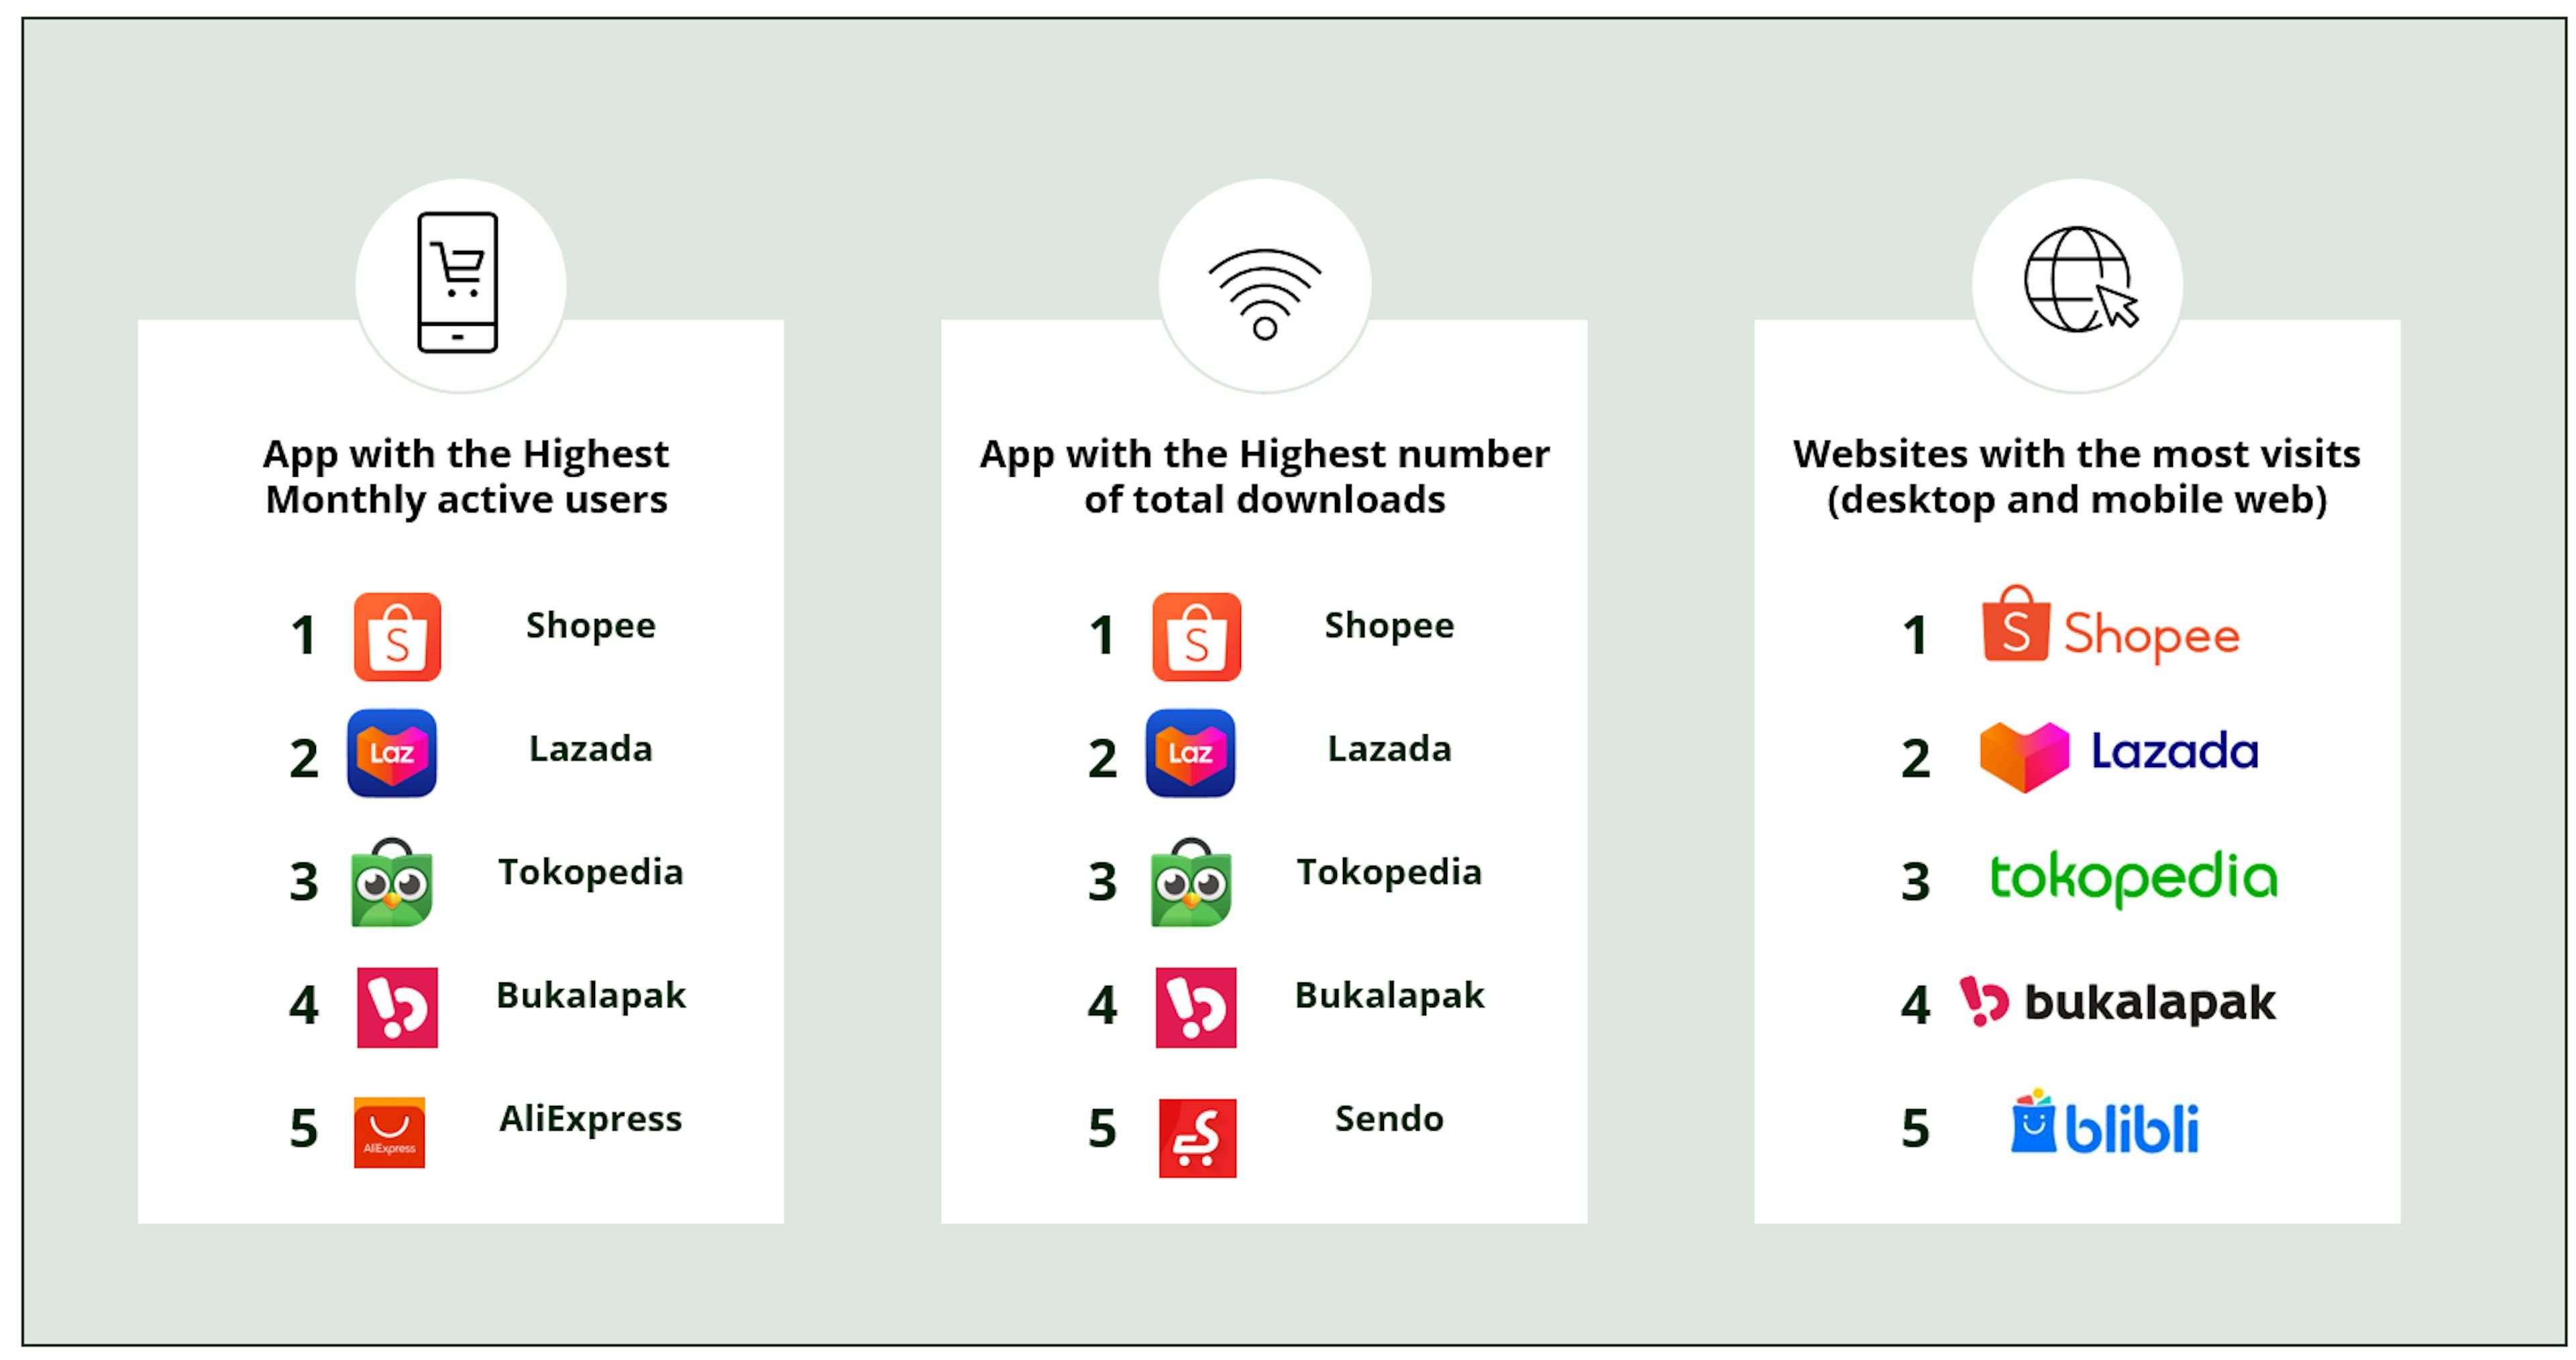
TOP 5 ECOMMERCE PLATFORMS IN SOUTHEAST ASIA IN 2023
Vietnam: A growing global footprint
Vietnam has also ascended as one of SE Asia’s most dynamic economies, becoming the manufacturing hub of the world, taking over from China. Leveraging its position as an alternative trading partner – challenging both China’s manufacturing dominance and India’s IT services exports – Vietnam has made significant strides. After experiencing a challenging period during the pandemic and subsequent export decline, Vietnam has rebounded strongly with record trade surpluses, further securing its reputation as an emerging export powerhouse. In fact, (after the correction of the past years, Vietnamese equities markets now have attractive valuations) these experiences may mean the valuations of some of the country’s most promising companies are particularly attractive.
Domestically, Vietnam’s economy is stabilising, with a resurgence in spending, credit growth and infrastructure development that collectively support its industrial ambitions. Mid-2024, Vietnam recorded the largest external surpluses in its history, at about 7% of GDP. And despite its $400 billion economy and population of 100 million8, Vietnam is absent from global indices, presenting a rare opportunity for active investors looking for growth.
In July 2024, the unexpected death of General Secretary Trong, led to the appointment of President and politburo member To Lam, taking on the acting role of the general secretary. While this new acting general secretary appears to be accumulating almost as much powers as his Chinese counterpart, the implied stability that it brings, combined with his pragmatism and pro-economic growth agenda point to an environment which is very conducive for companies to prosper.
Opportunities in high-growth sectors
When selecting stocks, Carmignac’s EM team looks for companies that offer compounding growth in underpenetrated sectors – two factors where Sea and FPT shine.
We are looking for companies with solid cash flow generation, self-financed growth, and success-hungry management teams, whittling our investment universe of 4000 securities to between 10 to 15 high-conviction selections across Asian large, mid, and small caps.
Carmignac’s strategy is to identify these opportunities early, including by keeping close relationships with private companies in anticipation of their going public to be able to invest during their IPOs.
Whether investing in large-cap companies via our flagship global EM Equity strategy, Carmignac Portfolio Emergents Fund, or in all-cap Emerging Asia companies via Carmignac Portfolio Asia Discovery Fund, our goal remains the same: to uncover compounders capable of sustaining long-term growth, reinvesting the proceeds of their success, while achieving a positive outcome on society or the environment, financing sectors or businesses where there are strong needs.
“We are looking for companies with solid cash flow generation, self-financed growth, and success-hungry management teams.”
Why now? A success story that is set to continue
The ASEAN region is well on track to becoming the fourth-largest economy in the world by 20309. The region benefits from a young, fast-growing population. While many advanced economies are grappling with ageing workforces, SE Asia’s youthful demographic is a competitive edge, forming a tech-savvy middle class that is eager to spend.
Moreover, with global easing cycle continuing and inflation under control in Asia, local central banks can cut rates without jeopardizing their currencies. This is particularly the case for Indonesia and Philippines that had aggressively increased rates with the Federal Reserve tightening and now are cutting rates.
Investment wise, SE Asia markets play an important role in EM portfolios, acting as an effective diversification tool as the region shows low correlation with developed markets and also when compared with other Emerging regions, such as Latin America or India (see chart below).
They also provide a low beta exposure and compelling valuations in absolute and relative terms compared to Taiwan and other North Asian Tech companies.
Finally, in an environment marked by many concerns around the structural outlook for China, SE Asia emerges as an appealing alternative. Not only does it represent a China plus one alternative alongside India, but one with more compelling valuations given the stretched valuations in India following the solid performance of the past years.
MSCI ASEAN CORRELATIONS WITH DEVELOPED AND MAIN EM MARKETS OVER 3 YEARS (IN EUR)10

1 Sources: Bloomberg, MSCI, World Bank, 31/12/2024
2IMF : https://www.imf.org/external/datamapper/NGDP_RPCH@WEO/OEMDC/WEOWORLD/GUY/SUR/BRA/COL/ADVEC/AS5
3UNCTAD, ASEAN Investment reports 2024
4Multiples sources : https://www.scmp.com/tech/tech-trends/article/3206362/chinese-supplier-apple-samsung-screens-build-new-factories-vietnam
https://www.cnbc.com/2024/06/24/southeast-asia-is-the-top-choice-for-firms-diversifying-away-from-china.html
https://asia.nikkei.com/Business/Business-Spotlight/Malaysia-aims-for-chip-comeback-as-Intel-Infineon-and-more-pile-in
https://www.thestar.com.my/news/nation/2024/05/28/m039sia-to-become-global-semiconductor-rd-hub-attract-billions-in-investment-says-pm. https://thediplomat.com/2024/01/the-role-of-thailand-in-germanys-auto-manufacturing-future/
https://issuu.com/germanthaichamber/docs/update_q2-2024_pharmaceutical_industry_and_trends/s/46389208
https://foreignpolicy.com/2024/05/08/indonesia-electric-vehicle-green-transition-china-tariffs
5Sources: IMF : https://www.imf.org/external/datamapper/NGDP_RPCH@WEO/OEMDC/WEOWORLD/GUY/SUR/BRA/COL/ADVEC/AS5
6Source : Bloomberg 31/01/2025
7Source: TMO Group Asia, SeekingAlpha Research, Company data, 31/12/2024.
8Source: World Bank, Haver 31/12/2024.
9Source: IMF World Economic Outlook forecasts published on Jan 2025.
10Source: Bloomberg, 31/01/2025.
Carmignac Portfolio Emergents F EUR Acc
- Recommended minimum investment horizon
- 5 years
- Risk indicator*
- 4/7
- SFDR - Fund Classification**
- Article 9
*Risk Scale from the KID (Key Information Document). Risk 1 does not mean a risk-free investment. This indicator may change over time. **Sustainable Finance Disclosure Regulation (SFDR) 2019/2088. The SFDR classification of the Funds may change over time.
Main risks of the fund
Fees
- Entry costs
- We do not charge an entry fee.
- Exit costs
- We do not charge an exit fee for this product.
- Management fees and other administrative or operating costs
- 1.15% of the value of your investment per year. This estimate is based on actual costs over the past year.
- Performance fees
- 20.00% when the share class overperforms the Reference indicator during the performance period. It will be payable also in case the share class has overperformed the reference indicator but had a negative performance. Underperformance is clawed back for 5 years. The actual amount will vary depending on how well your investment performs. The aggregated cost estimation above includes the average over the last 5 years, or since the product creation if it is less than 5 years.
- Transaction Cost
- 0.39% of the value of your investment per year. This is an estimate of the costs incurred when we buy and sell the investments underlying the product. The actual amount varies depending on the quantity we buy and sell.
Performance
| Carmignac Portfolio Emergents | +16.5 | +23.6 | +5.5 | +9.8 | −14.3 | −10.3 | +44.9 | +25.5 | −18.2 | +19.8 |
| Reference Indicator | +19.4 | +17.8 | +14.7 | +6.1 | −14.9 | +4.9 | +8.5 | +20.6 | −10.3 | +20.6 |
| Carmignac Portfolio Emergents | +16.9% | +6.1% | +8.0% |
| Reference Indicator | +20.1% | +7.7% | +8.0% |
Source: Carmignac at Oct 30, 2026.
Past performance is not necessarily indicative of future performance. Performances are net of fees (excluding possible entrance fees charged by the distributor). The Fund presents a risk of loss of capital.
The return may increase or decrease as a result of currency fluctuations, for the shares which are not currency-hedged.
Reference Indicator: MSCI EM NR index
Carmignac Portfolio Asia Discovery F EUR Acc
- Recommended minimum investment horizon
- 5 years
- Risk indicator*
- 4/7
- SFDR - Fund Classification**
- Article 8
*Risk Scale from the KID (Key Information Document). Risk 1 does not mean a risk-free investment. This indicator may change over time. **Sustainable Finance Disclosure Regulation (SFDR) 2019/2088. The SFDR classification of the Funds may change over time.
Main risks of the fund
Fees
- Entry costs
- We do not charge an entry fee.
- Exit costs
- We do not charge an exit fee for this product.
- Management fees and other administrative or operating costs
- 1.33% of the value of your investment per year. This estimate is based on actual costs over the past year.
- Performance fees
- 20.00% when the share class overperforms the Reference indicator during the performance period. It will be payable also in case the share class has overperformed the reference indicator but had a negative performance. Underperformance is clawed back for 5 years. The actual amount will vary depending on how well your investment performs. The aggregated cost estimation above includes the average over the last 5 years, or since the product creation if it is less than 5 years.
- Transaction Cost
- 0.25% of the value of your investment per year. This is an estimate of the costs incurred when we buy and sell the investments underlying the product. The actual amount varies depending on the quantity we buy and sell.
Performance
| Carmignac Portfolio Asia Discovery | +41.8 | +5.8 | +30.1 | +13.8 | −21.6 | +26.4 | +0.9 | +10.7 | −8.0 | +19.0 |
| Reference Indicator | +35.5 | +12.4 | +9.9 | +14.9 | −11.7 | +21.3 | +5.4 | +14.4 | −11.6 | +18.1 |
| Carmignac Portfolio Asia Discovery | +28.5% | +11.4% | +9.7% |
| Reference Indicator | +22.3% | +11.6% | +9.8% |
Source: Carmignac at Oct 30, 2026.
Past performance is not necessarily indicative of future performance. Performances are net of fees (excluding possible entrance fees charged by the distributor). The Fund presents a risk of loss of capital.
The return may increase or decrease as a result of currency fluctuations, for the shares which are not currency-hedged.
Reference Indicator: MSCI EM Asia Ex-China IMI 10/40 Capped NR index