
Carmignac Portfolio Merger Arbitrage Plus: Letter from the Fund Managers
Dear Investors,
During the last quarter of the year, our Carmignac Merger Arbitrage (I share class EUR Acc) achieved a performance of 1%, while Carmignac Merger Arbitrage Plus (I share class EUR Acc) rose 1.1%.
In the last quarter, M&A activity showed a real rebound compared with the previous quarter. Indeed, 86 M&A deals announced in the US, Europe and Asia during Q4 2023 were eligible for our portfolio, which was up 32% on the previous quarter. As usual, the US remains the largest market with 48% of the total, with Europe and Asia sharing the remainder with 26% and 27% each. The average deal size is $6 billion in the US, compared with around $2 billion in Europe and Asia. When we look at M&A activity by value, the upturn is even more notable, with a total of $340 billion worth of deals announced in the last quarter, almost double the figure for the previous quarter.
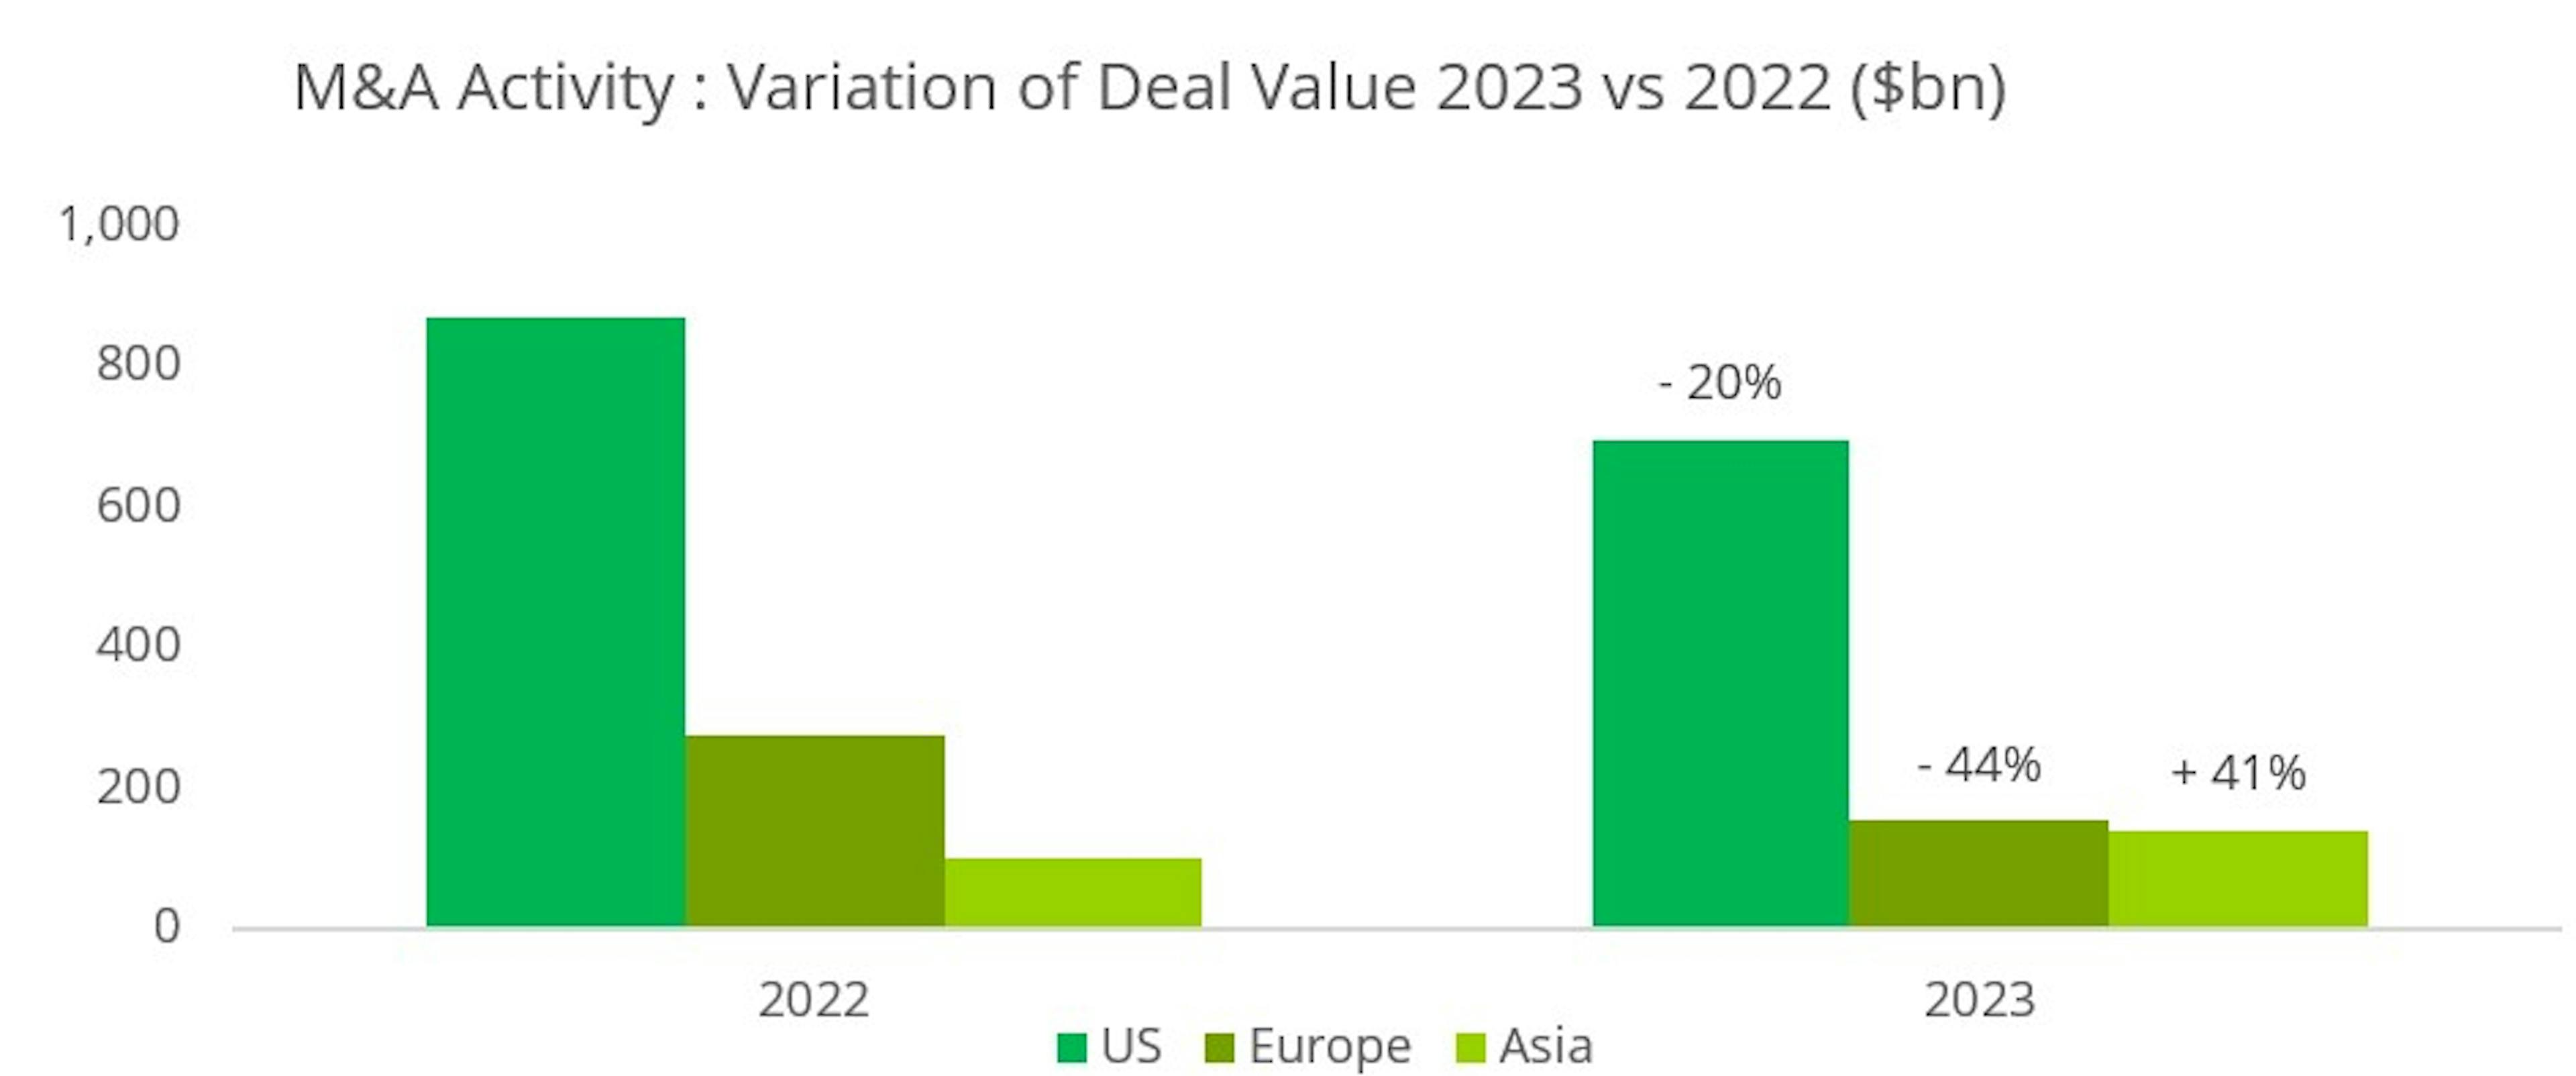
The final quarter is also a good time to take stock of the M&A year that has just ended. At the start of the year, many thought that rising interest rates in the US and Europe would bring M&A activity to a halt. While it is true that there has been a decline in value this year, a detailed analysis reveals a more complex reality. In fact, M&A activity has decreased overall in value in 2023 compared with 2022: deals announced during this year represented a total of $991bn, an annual decline of 20%. There are several points to bear in mind when analysing this figure.
Firstly, this fall is actually smaller than one might have feared at the start of the year, given the scale and speed of the rise in interest rates.
Secondly, the level of activity achieved this year is in line with what was seen on average before 2018, when rates were significantly lower. The geographical disparity is also interesting to note: while the US is down by 20%, Europe is down more sharply by 44%, while Asia is up by 41%.
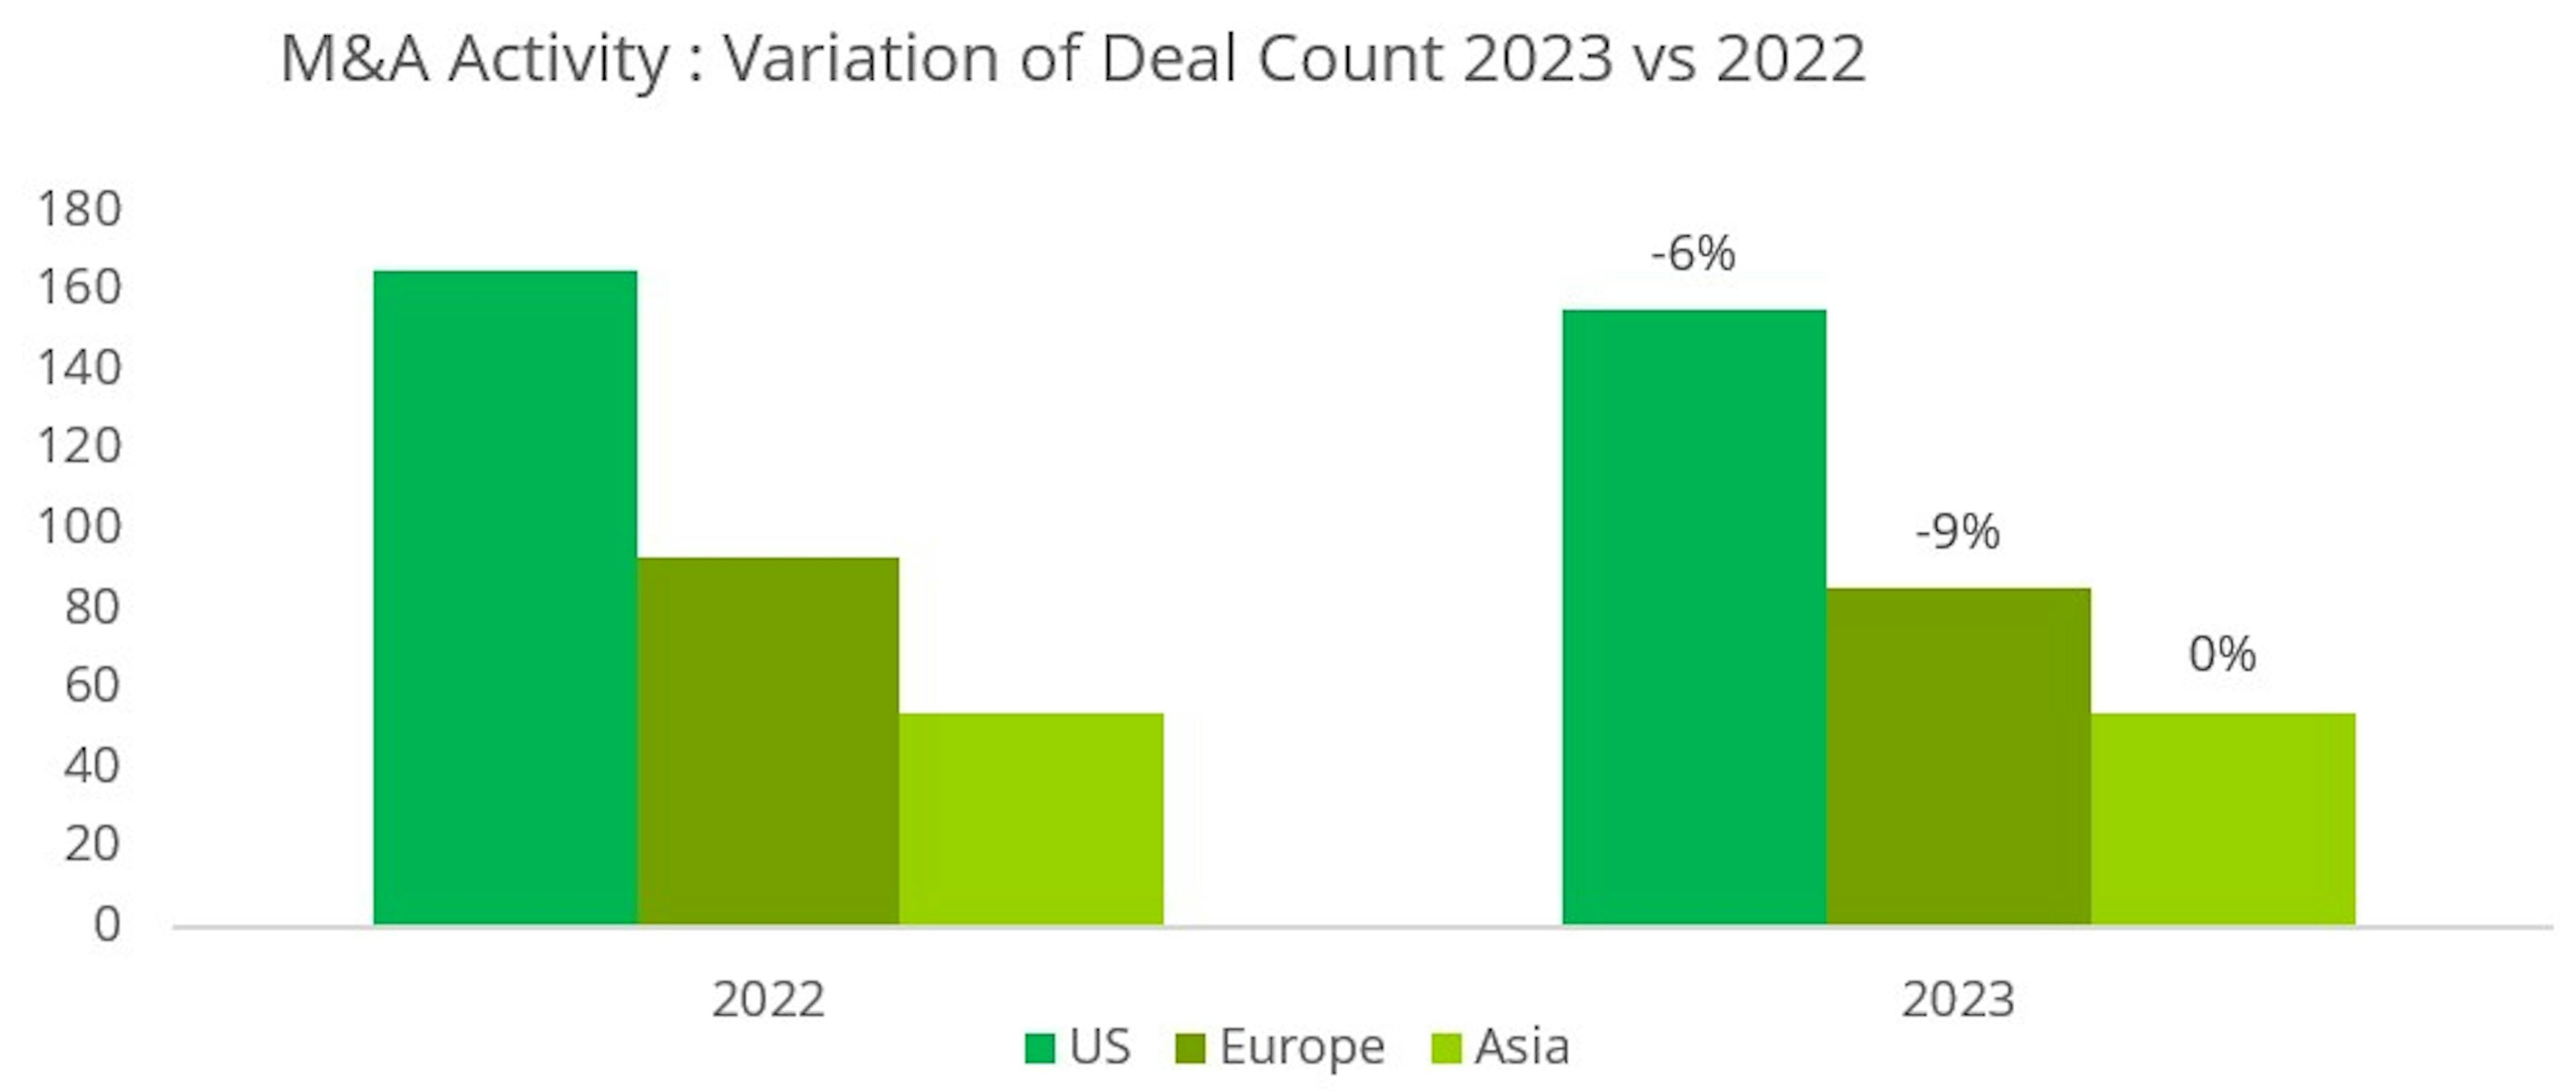
Finally, if we look not at value but at volume, i.e. the number of transactions, the fall in M&A activity is much more modest. With 294 new deals announced for 2023, the fall is only 6% on 2022.
This is an important point to emphasise because, for us as arbitrageurs, it is the number of transactions, rather than the size of the deals themselves, that enables us to deploy capital in our funds while maintaining good diversification.
The sectoral breakdown of M&A activity is also interesting to analyse, as it reflects a real change from what we have seen in the recent past, and probably foreshadows a new trend for the future.
We are witnessing the return of the "old economy". While Healthcare and Technology remain two important sectors, accounting for 20% and 11% respectively of total announced deals in the US, Energy has become the leading sector with 26% and Industrials/Commodities the third with 14%. In Asia, the trend is even more pronounced, with the Industrial/Raw Materials and Utilities sectors together accounting for almost 70% of the total. The drivers behind this trend are powerful and structural: sector growth driven by the energy transition, a solid balance sheet for strategic players, and significant synergies and economies of scale in the event of mergers.
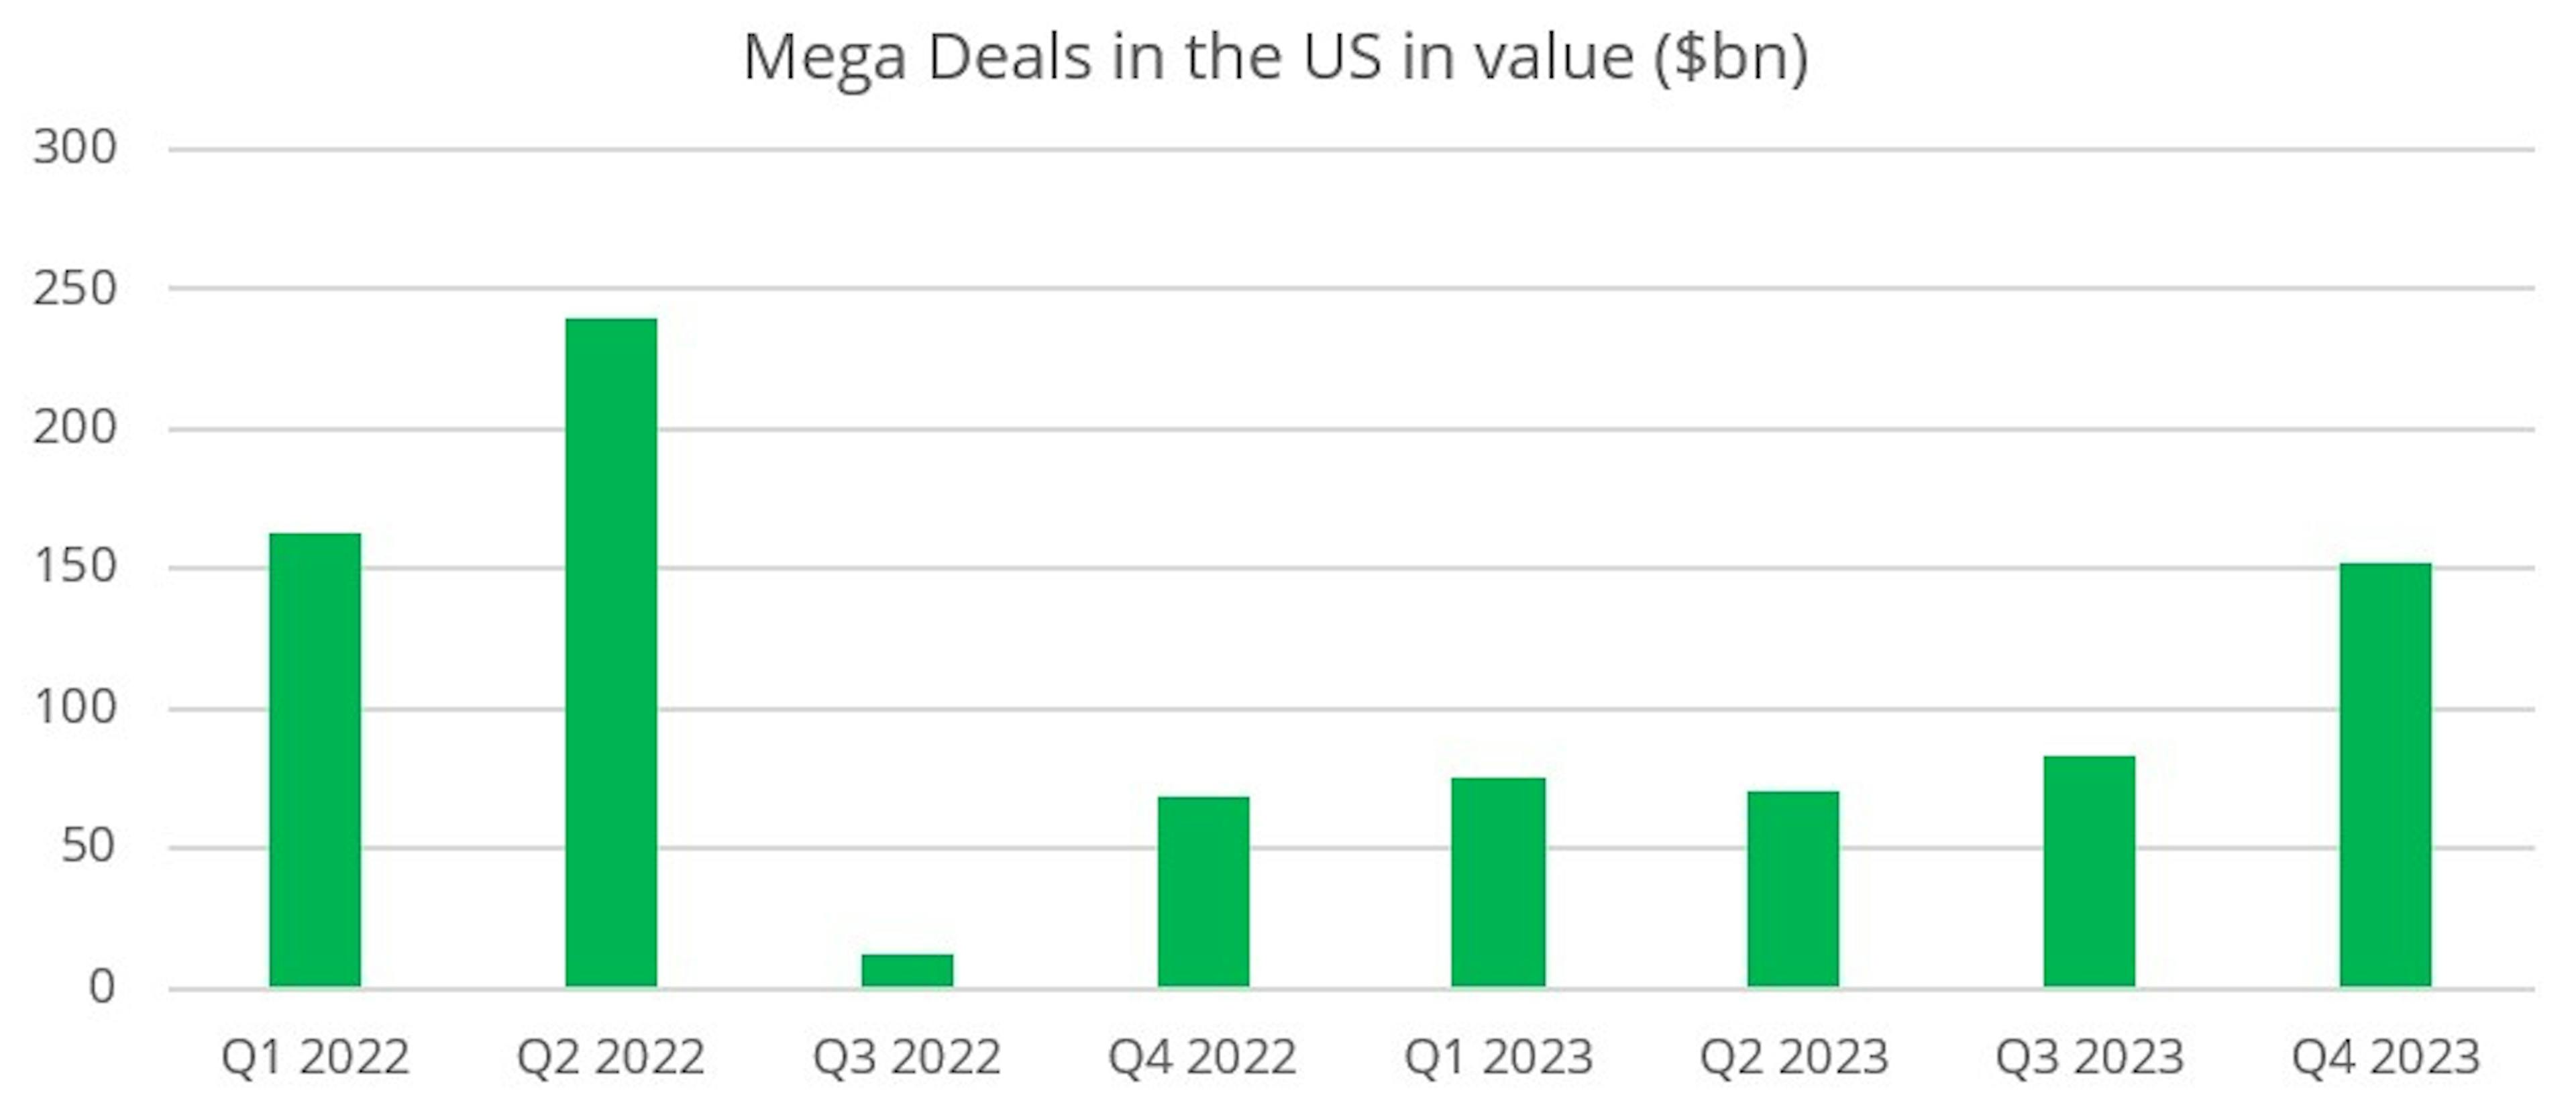
The final highlight of the year is the gradual return of "mega deals" in the US, i.e. deals in excess of $10bn, which had disappeared from the landscape somewhat during 2022. This type of deal had become the Federal Trade Commission’s (FTC) favourite target, particularly in key sectors such as technology (Activision, VMWare, Black Knight) and healthcare (Seagen). But the fact that the FTC failed to block some of these emblematic deals, such as Activision and Seagen, has probably given companies renewed confidence to embark on major external growth projects.
With the fall in the US 10-year yield and the prospect of the end of the cycle of key rate hikes, the equity and bond markets rebounded strongly in the last quarter of 2023, with the S&P 500 and US Investment Grade up 11.7% and 10.0% respectively.
Looking at the Merger Arbitrage strategy, our Carmignac Merger Arbitrage (I share class EUR Acc) and Carmignac Merger Arbitrage Plus (I share class EUR Acc) funds posted a more modest increase of 1% and 1.1% respectively, but which remains entirely satisfactory in terms of management objectives. Several factors explain this performance.
Firstly, the pressure from the anti-trust authorities, which we had seen at the start of the year, particularly in the USA, tended to normalise throughout 2023. Two major deals, Pfizer's $41bn takeover of Seagen and Cisco's $28bn acquisition of Splunk, were approved by the FTC during the fourth quarter.
We also benefited from two improved offers. The first was the result of the stock market battle to buy the management company Sculptor Capital between Rithm Capital and a group of investors led by Boaz Weinstein. Rithm Capital's initial offer was eventually increased by almost 14%. The second improved offer concerns the mining company Azure Minerals. Sociedad Quimica y Minera de Chile, a leading Chilean lithium miner, initially launched a standalone offer at AU$3.50, which was subsequently increased by almost 6% with the support of Australian company Hancock Prospecting.
Finally, a large number of transactions, 88 in total in the US, came to an end during the quarter. The convergence of discounts on these deals was a good performance driver at the end of the year.
On the other hand, several factors had a negative impact on the fund's performance during the quarter. While the FTC approved a number of major deals, it also launched in-depth investigations into two other transactions, Tapestry's acquisition of Capri Holdings in the luxury handbag sector and Campbell Soup's acquisition of Sovo in the food sector. Although partly anticipated by the market, this bad news led to a widening of the two discounts, creating greater volatility.
The other negative factor of the month was the high volatility of discounts in the oil sector, particularly the one on the Hess/Chevron deal. Tensions between Venezuela and Guyana escalated in December over the territorial dispute centred on the Essequibo region. After holding a referendum on Venezuelan sovereignty over the Essequibo, Venezuela launched a defensive military manoeuvre on the border between the two countries. As Hess holds the vast majority of its assets in Guyana, the discount on the deal initially fell sharply before tightening at the end of the month following a meeting between the Venezuelan and Guyanese heads of state mediated by Brazil. We note that the merger agreement between Hess and Chevron is extremely strong and that the escalation of tensions alone cannot be a sufficient reason to withdraw from this operation. Chevron has also reaffirmed its interest in acquiring Hess.
Finally, despite significant improvements, Brookfield and EIG Global Energy's bid for Australian power producer Origin Energy failed as a result of shareholder opposition led by the Australian Super pension fund. As we had correctly estimated the Origin Energy share price in the event of the deal failing, the impact on performance was limited.
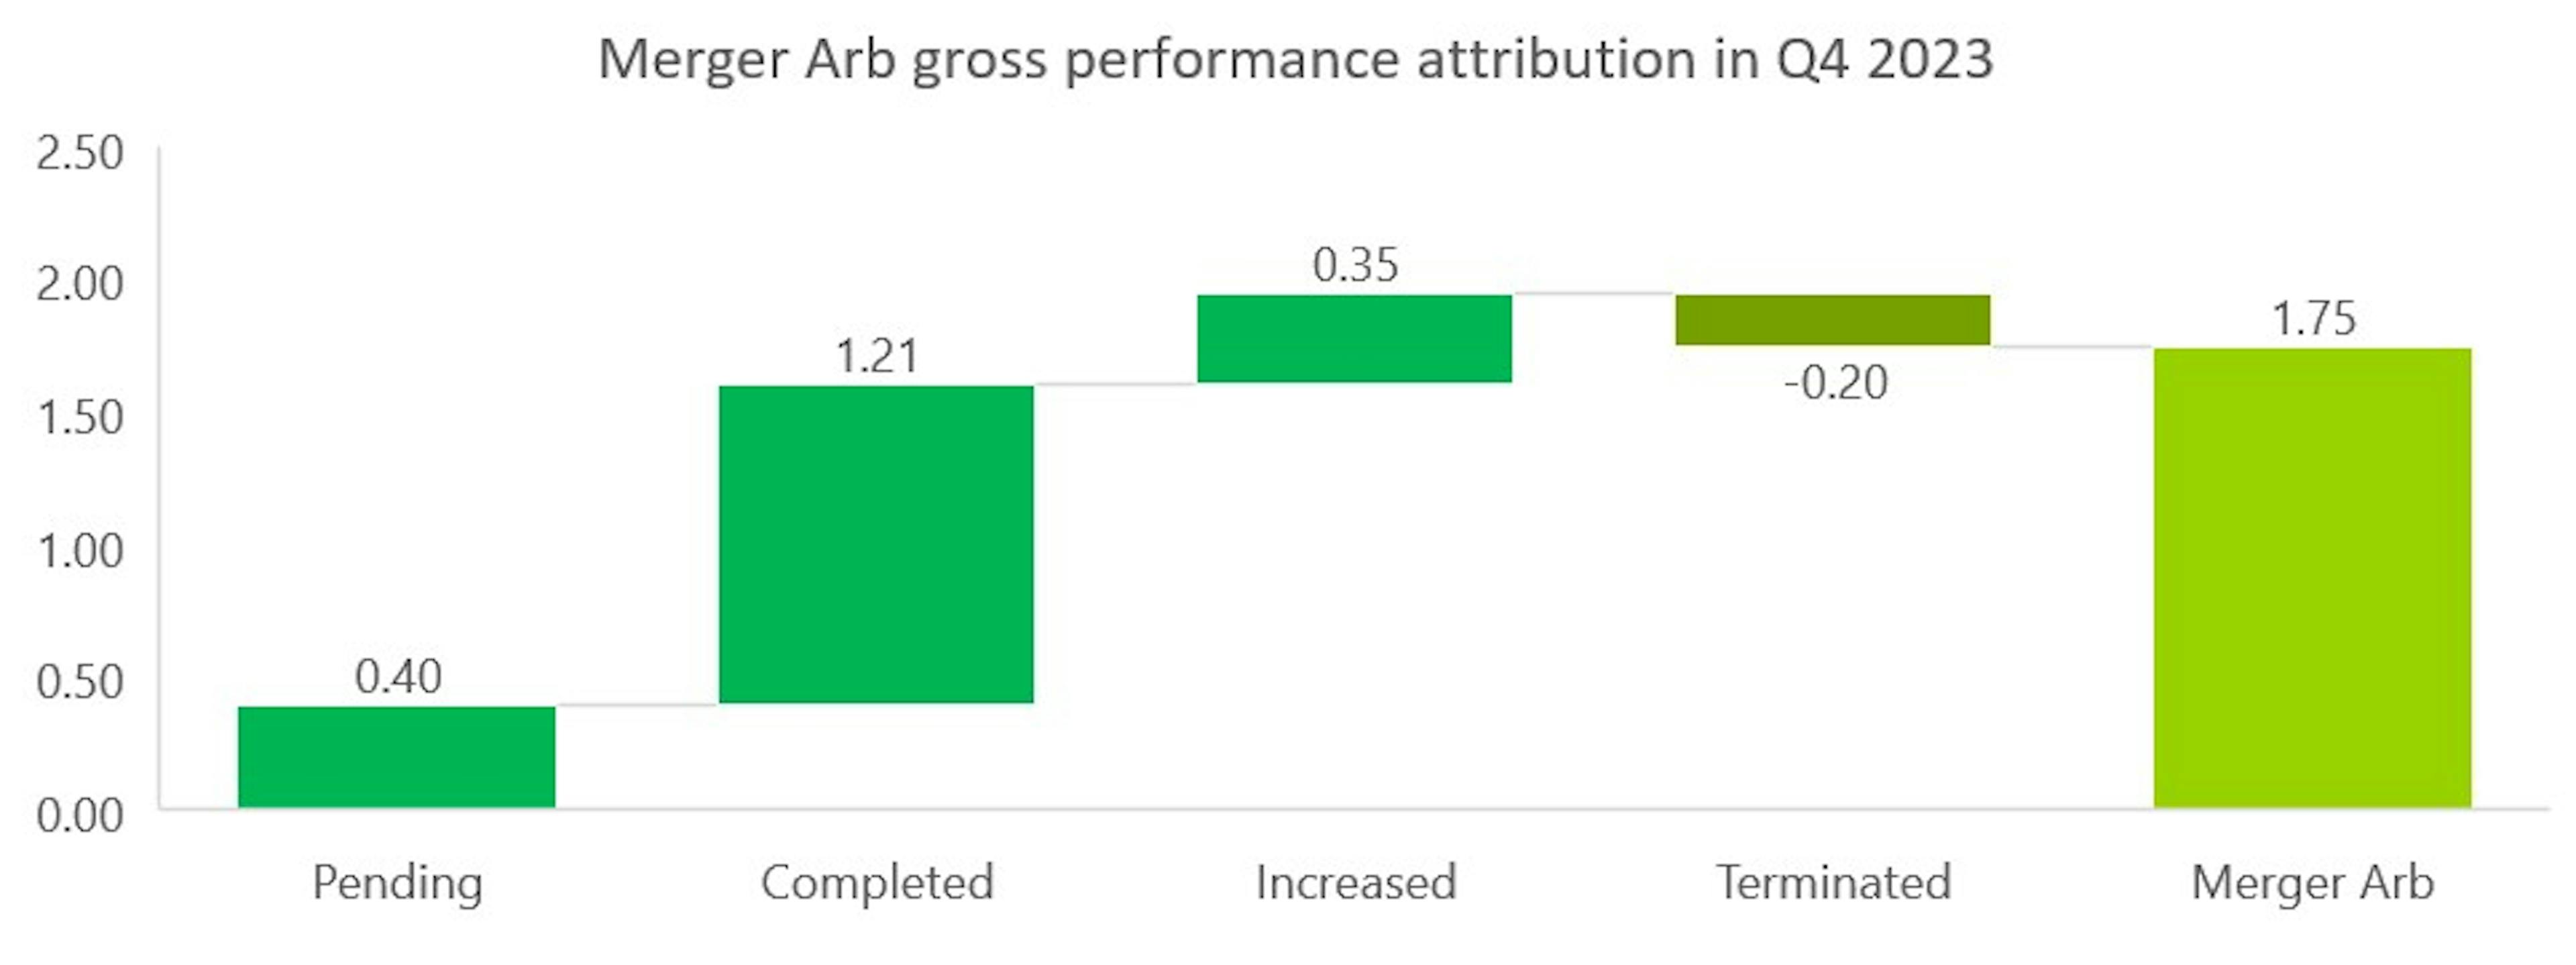
Another way of breaking down the fund's performance is to look at the status of the deal at the end of the period. A bid can be either:
- In progress: the deal has not yet been finalised because all the conditions precedent have not yet been lifted;
- Closed: the transaction has been finalised in accordance with the initial terms;
- Improved: the buyer has increased its price or a third party has come in with a higher offer;
- Abandoned: the deal failed.
Using this methodology, we obtain the following performance attribution table for Carmignac Portfolio Merger Arbitrage Plus:
The table for Carmignac Portfolio Merger Arbitrage is as follows:
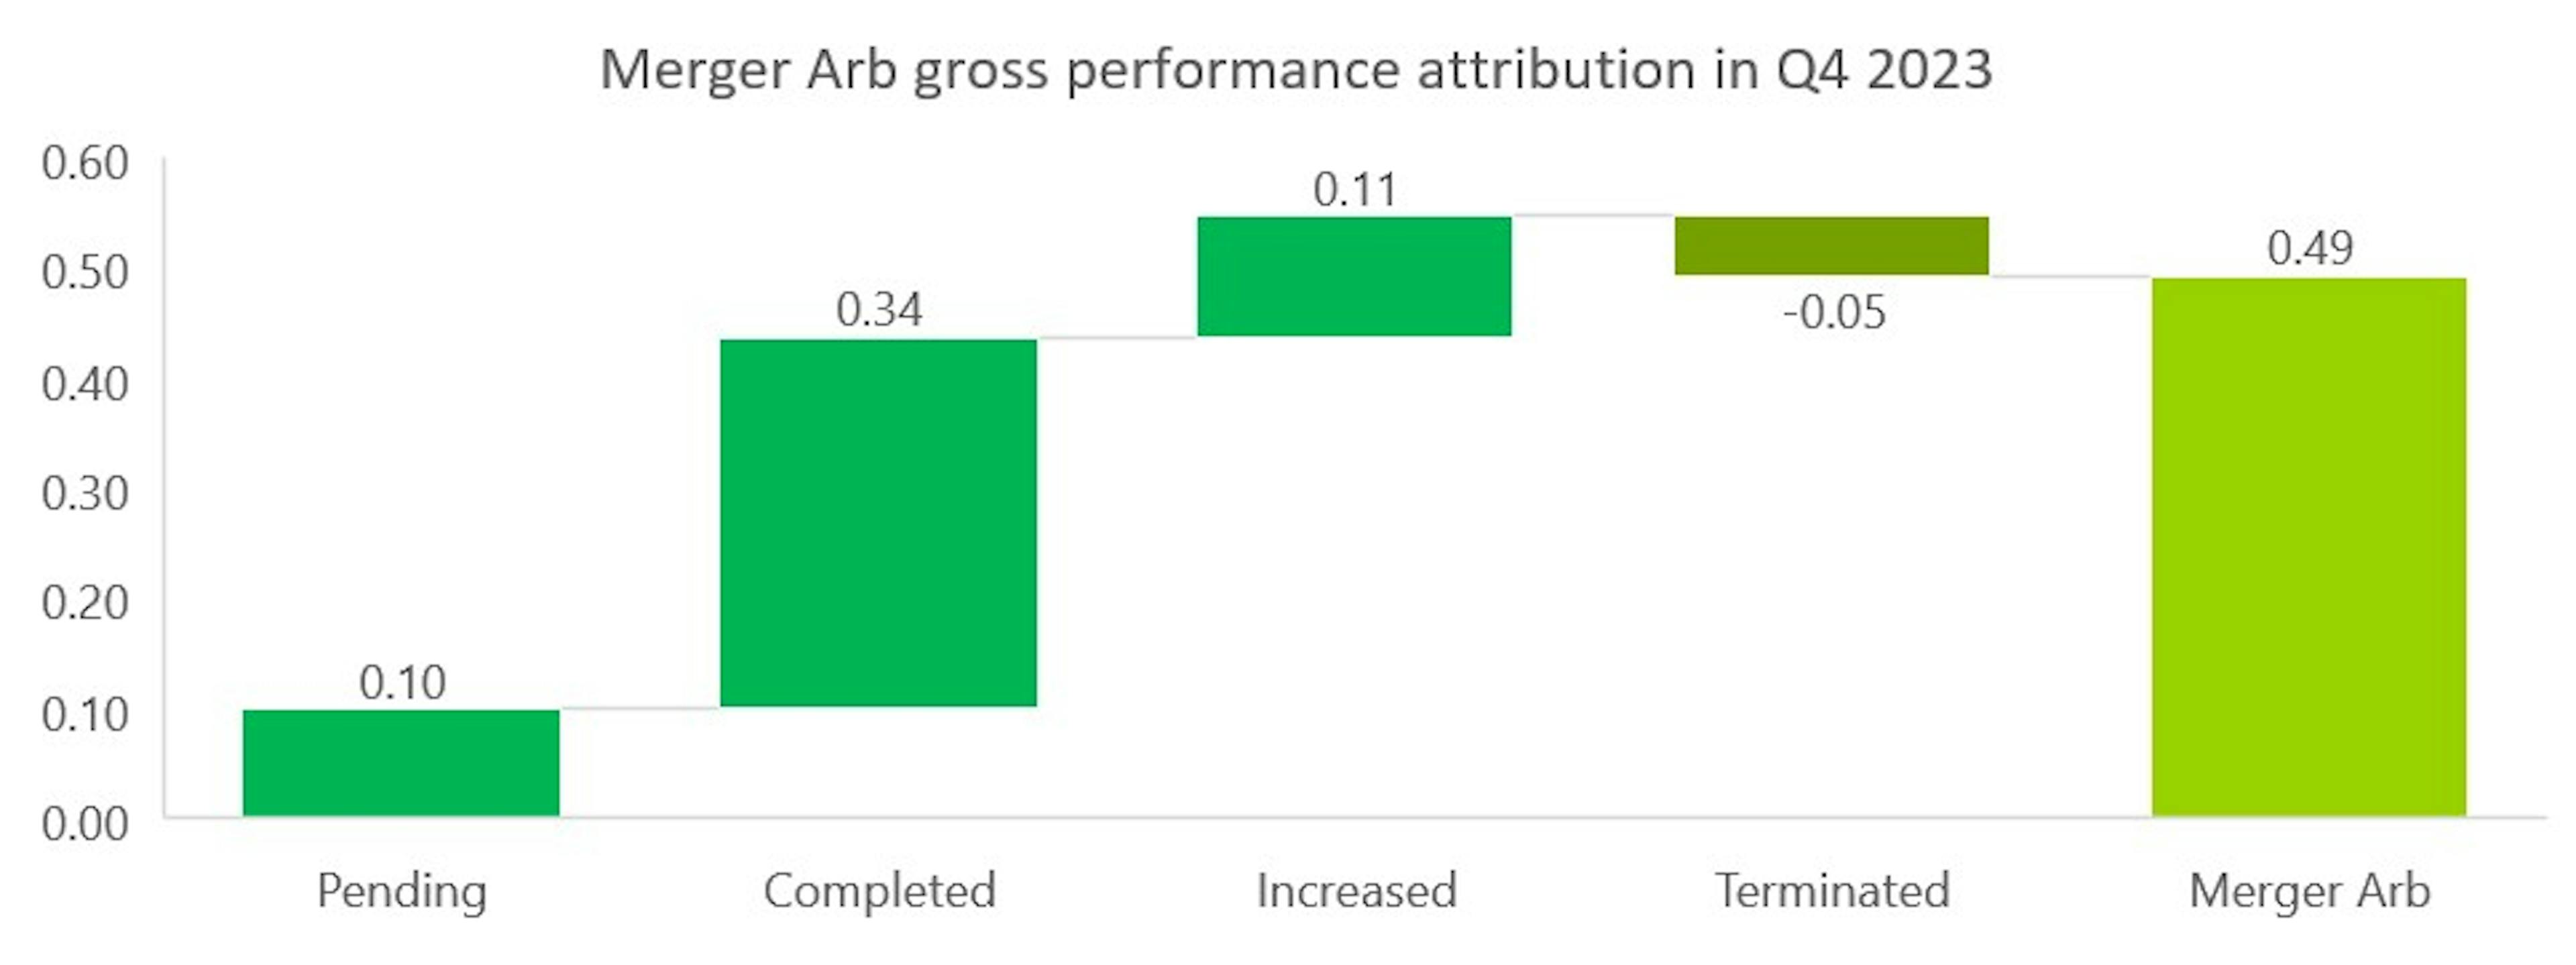
The main driver of performance was the completion of a large number of transactions in the portfolio. Given the increased volatility on certain discounts such as Sovo, Capri and Hess, the 'Pending' category contributed little to performance during the quarter. It should also be noted that the failure of the Origin Energy deal was more than offset by improved offers, notably the one for Sculptor.
This year-end is also an opportunity to take stock, since the funds were created in April 2023, of the two other key management parameters: volatility and correlation with the main asset classes.
In a year that was ultimately turbulent for all markets, our Merger Arbitrage strategy delivered on its promise of controlled volatility and low correlation. Carmignac Portfolio Merger Arbitrage has a volatility of 0.7% and a correlation to equities of 0.24 and High Yield credit of 0.12.
Carmignac Portfolio Merger Arbitrage Plus has a volatility of 2.1% and a correlation to equities of 0.26 and to High Yield credit of 0.14.
For the year ahead, we are confident that the good momentum seen in Q4 2023 will continue. Indeed, a historical study of M&A activity shows that, while there is a degree of cyclicality, downturns in activity tend on average to be short-lived. For 2024, the drivers of the recovery are already there:
- The end of the rate hike cycle is approaching, which should give business leaders a degree of visibility;
- Return of mega deals in most economic sectors;
- Sectoral shift in M&A activity towards the "old economy", driven in particular by the energy transition;
- A greater proportion of strategic players than financial players, who are more penalised by high interest rates;
- In some sectors, such as technology and healthcare, external growth is structurally an integral part of development models.
The Merger Arbitrage Team

Carmignac Portfolio Merger Arbitrage Plus
An active absolute return strategy focusing on merger arbitrage opportunitiesDiscover the fund pageCarmignac Portfolio Merger Arbitrage Plus I EUR Acc
- Duración mínima recomendada de la inversión
- 3 años
- Escala de riesgo*
- 2/7
- Clasificación SFDR**
- Artículo 8
*Escala de riesgo del KID (Documento de datos fundamentales). El riesgo 1 no implica una inversión sin riesgo. Este indicador podría evolucionar con el tiempo. **El Reglamento SFDR (Reglamento sobre la divulgación de información relativa a la sostenibilidad en el sector de los servicios financieros, por sus siglas en inglés) 2019/2088 es un reglamento europeo que requiere a los gestores de activos clasificar sus fondos, en particular entre los que responden al «artículo 8», que promueven las características medioambientales y sociales, al «artículo 9», que realizan inversiones sostenibles con objetivos medibles, o al «artículo 6», que no tienen necesariamente un objetivo de sostenibilidad. Para más información, visite: https://eur-lex.europa.eu/eli/reg/2019/2088/oj?locale=es.
Principales riesgos del Fondo
Gastos
- Costes de entrada
- No cobramos comisión de entrada.
- Costes de salida
- No cobramos una comisión de salida por este producto.
- Comisiones de gestión y otros costes administrativos o de funcionamiento
- 1,11% del valor de su inversión al año. Se trata de una estimación basada en los costes reales del último año.
- Comisiones de rendimiento
- 20,00% max. del exceso de rentabilidad cuando la rentabilidad sea positiva y el valor liquidativo supere la cota máxima o «High-Water Mark». El importe real variará en función de lo buenos que sean los resultados de su inversión. La estimación de los costes agregados anterior incluye la media de los últimos 5 años, o desde la creación del producto si se produjo hace menos de 5 años.
- Costes de operación
- 0,45% del valor de su inversión al año. Se trata de una estimación de los costes en que incurrimos al comprar y vender las inversiones subyacentes del producto. El importe real variará en función de la cantidad que compremos y vendamos.
Rentabilidades
| Carmignac Portfolio Merger Arbitrage Plus | 3.2 | 3.7 | 1.7 |
| Carmignac Portfolio Merger Arbitrage Plus | + 5.0 % | - | + 4.2 % |
Fuente: Carmignac a 30 de abr. de 2025.
Las rentabilidades históricas no garantizan rentabilidades futuras. La rentabilidad es neta de comisiones (excluyendo las eventuales comisiones de entrada aplicadas por el distribuidor)
Indicador de referencia: -
Análisis recientes

En busca de diversificación en tiempos de incertidumbre
![[Main Media] [Funds Focus] Bridge](https://carmignac.imgix.net/uploads/article/0001/02/26ad7f7eb70cc9f1137127c5b230d8042189f9e1.jpeg?auto=format%2Ccompress&fit=fill&w=3840)
Carmignac Absolute Return Europe: Letter from the Fund Managers

Carmignac Merger Arbitrage: Letter from the Portfolio Managers
Comunicación publicitaria. Consulte el KID/folleto antes de tomar una decisión final de inversión. El presente documento está dirigido a clientes profesionales.
Este material no puede reproducirse, ni total ni parcialmente, sin el consentimiento previo de la sociedad gestora. Este material no constituye una oferta de suscripción ni un asesoramiento de inversión. Este material no constituye una recomendación contable, jurídica o tributaria y no debe ser tenido en cuenta a tales efectos. Este material se proporciona con carácter exclusivamente informativo y podría no resultar fiable a la hora de evaluar las ventajas derivadas de invertir en cualquier tipo de participaciones o valores mencionados en el presente documento o de cara a cualquier otra finalidad. La información contenida en este material podría no ser completa y estar sujeta a modificación sin preaviso alguno. Las informaciones se expresan a fecha de redacción del material y proceden de fuentes propias y externas consideradas fiables por Carmignac, no son necesariamente exhaustivas y su exactitud no está garantizada. En consecuencia, Carmignac, sus responsables, empleados o agentes no proporcionan garantía alguna de precisión o fiabilidad y no se responsabilizan en modo alguno de los errores u omisiones (incluida la responsabilidad para con cualquier persona debido a una negligencia). Las rentabilidades históricas no garantizan rentabilidades futuras.
La rentabilidad es neta de comisiones (excluyendo las eventuales comisiones de entrada aplicadas por el distribuidor). La rentabilidad podrá subir o bajar a resultas de las fluctuaciones en los tipos de cambio en el caso de las participaciones que carezcan de cobertura de divisas.
La mención a determinados valores o instrumentos financieros se realiza a efectos ilustrativos, para destacar determinados títulos presentes o que han figurado en las carteras de los Fondos de la gama Carmignac. Ésta no busca promover la inversión directa en dichos instrumentos ni constituye un asesoramiento de inversión. La Gestora no está sujeta a la prohibición de efectuar transacciones con estos instrumentos antes de la difusión de la información.
El acceso a los Fondos podrá estar restringido a determinadas personas o países. Este material no está dirigido a ninguna persona de ninguna jurisdicción en la que (debido al lugar de residencia o nacionalidad de la persona o a cualquier otra cuestión) el material o la disponibilidad de este material esté prohibido. Las personas objeto de estas prohibiciones no deben acceder a este material. La tributación depende de la situación de la persona. Los Fondos no están registrados para su distribución a inversores minoristas en Asia, Japón, Norteamérica ni están registrados en Sudamérica. Los Fondos Carmignac están registrados en Singapur como institución de inversión extranjera restringida (exclusivamente para clientes profesionales). Los Fondos no han sido registrados en virtud de la ley de valores estadounidense (US Securities Act) de 1933. Los Fondos podrán no ofertarse o venderse, directa o indirectamente, en beneficio o en nombre de una «Persona estadounidense», según la definición recogida por el Reglamento estadounidense S (Regulation S) y la ley FATCA. La decisión de invertir en el fondo debe tomarse teniendo en cuenta todas sus características u objetivos descritos en su folleto. Podrá consultar los folletos de los Fondos, los documentos KID, el VL y los informes anuales en la web www.carmignac.com/es-es o previa petición a la Gestora. Los riesgos, comisiones y gastos corrientes se detallan en el documento de datos fundamentales (KID). El KID deberá estar a disposición del suscriptor con anterioridad a la suscripción. El suscriptor debe leer el KID. Los inversores podrían perder parte o la totalidad de su capital, dado que el capital en los fondos no está garantizado. Los Fondos presentan un riesgo de pérdida de capital.
Para España : Los Fondos se encuentran registrados ante la Comisión Nacional del Mercado de Valores de España, con los números : Carmignac Sécurité 395, Carmignac Portfolio 392, Carmignac Patrimoine 386, Carmignac Absolute Return Europe 398, Carmignac Investissement 385, Carmignac Emergents 387, Carmignac Credit 2027 2098, Carmignac Credit 2029 2203, Carmignac Credit 2031 2297, Carmignac Court Terme 1111.
La Sociedad gestora puede cesar la promoción en su país en cualquier momento. Los inversores pueden acceder a un resumen de sus derechos en español en el siguiente enlace sección 5: www.carmignac.com/es-es/informacion-legal
Carmignac Portfolio hace referencia a los sub fondos de Carmignac Portfolio SICAV, una compañía de inversión bajo derecho luxemburgués, conforme a la directiva UCITS. Los Fondos son fondos comunes de derecho francés (FCP) conforme a la directiva UCITS o AIFM.
Para Carmignac Portfolio Long-Short European Equities: Carmignac Gestion Luxembourg SA, en su calidad de Sociedad Gestora de Carmignac Portfolio, ha delegado la gestión de la inversión de este Subfondo en White Creek Capital LLP (registrada en Inglaterra y Gales con el número OCC447169) a partir del 2 de mayo de 2024. White Creek Capital LLP está autorizada y regulada por la Financial Conduct Authority con el FRN : 998349.
Carmignac Private Evergreen hace referencia al compartimento Private Evergreen de la SICAV Carmignac S.A. SICAV – PART II UCI inscrita en el RCS luxemburgués con el número B285278.