
Carmignac Portfolio Grande Europe: Letter from the Fund Manager
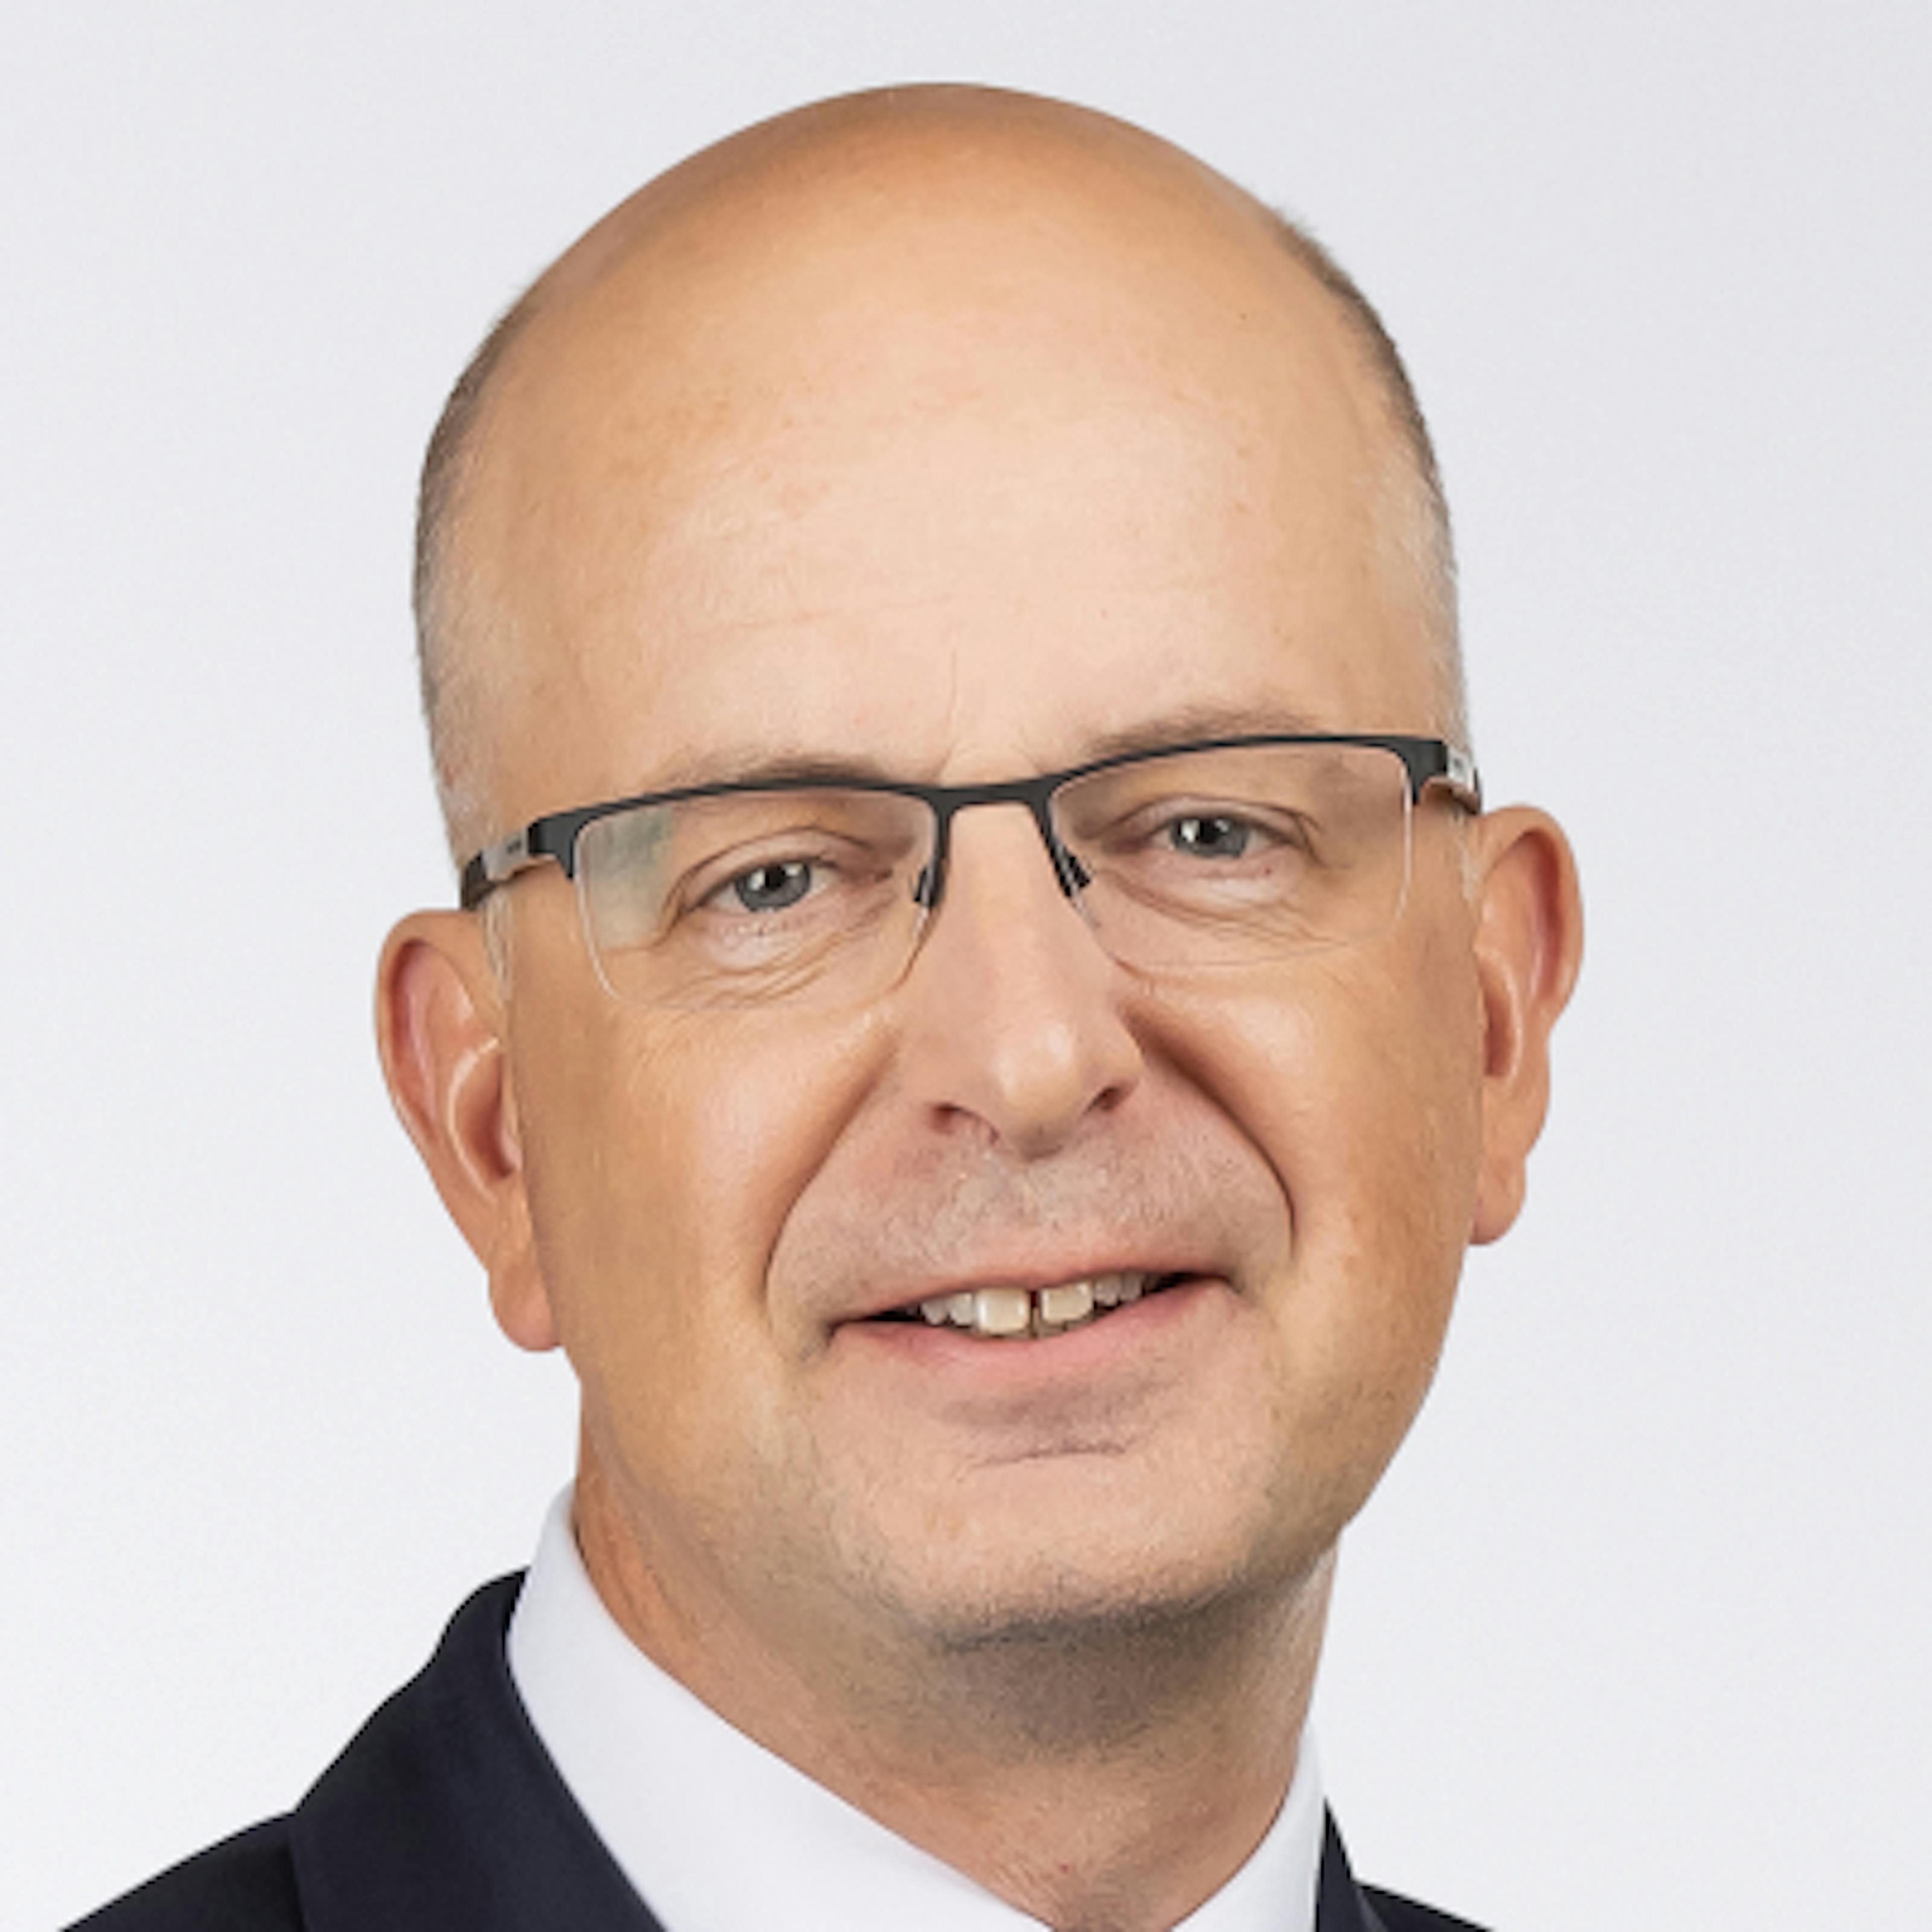
During the fourth quarter of 2023, the return of Carmignac Portfolio Grande Europe (A share class) was a positive return of +6.4%, providing a return just below the reference indicator which rose 6.7%. This meant for the full year, the fund rose +14.8% compared to the reference indicator which rose +15.8%.
Market environment during the period
The year started strongly, continuing the momentum that had started in the previous quarter. Recession worries faded due to fiscal support for consumers, falling gas prices in Europe, as well as a rapid Chinese reopening. Just when European markets had come to grips with the multiple central bank rate hikes, attention shifted to commercial banks as they raised investor concerns on the back of US and Swiss bank failures. In the meantime, energy prices and overall inflation had started to subside and China’s post-Covid lockdown release had re-started global supply chains helping further ease inflation concerns. As a result, the widely anticipated recession had been pushed back and the macroeconomic outlook had become less gloomy.
Following the strong performance of European equities in the first half of the year, markets fell back in the third quarter. While the second quarter earnings reporting season had been relatively uneventful, and consistent with full year expectations of little profits growth overall, worldwide pressure on stock prices came once again from ever-rising bond yields. European markets rebounded in the last quarter and finished the year by rising c7% in the quarter to finish the year up a respectable 16%. The catalyst for this was the prospect of an easing of monetary policy in 2024. The European Central Bank (ECB) announced in late Q3 that they had completed their interest rate hikes. Following this announcement, we received a series of positive inflation reports, culminating in a Consumer Price Index (CPI) reading of approximately 2.4% in November, compared to 10% in November of the previous year. Similar trends were observed in the United States. The US Federal Reserve (Fed) subsequently confirmed interest rates will likely be cut in 2024, thus raising the prospect of a so-called “soft landing” with inflation under control, falling interest rates and no recession. It is worth noting, however, that the ECB chose to maintain a more orthodox stance than its American counterpart, indicating that possible rate cuts were not yet on the agenda.
How did we fare in this context ?
During the year, the Fund recorded a positive absolute performance, though below its reference indicator. In the first months of the year, the sectoral mix was unfavourable for our strategy as we have little exposure to banks, retail and autos, however the volatility in March allowed us to catch up and finish the period in line with our reference indicator, helped by the fact we had no bank exposure.
During the first quarter, Technology names delivered a strong contribution. Our second best contributor during the year, SAP, rose 47% thanks to a strong first quarter, where the company delivered impressive full year results, demonstrating ongoing strong momentum in cloud business with strong sales growth underlining the fact that the transition of customers from license-based products to more valuable cloud-based ones is consistent. During the second quarter, Healthcare overall was not a particularly strong sector in the period, but our names did particularly well. Zealand Pharma, a drug company exposed to obesity, rose 14% ahead of strong clinical data for one of their candidates at an industry conference, while our smallest healthcare name, the biotech Merus, rose a stunning 40%.
In the third quarter, some stock specific events disappointed and weighed on returns. Indeed, Orsted, the wind farm developer, took additional write downs on unprofitable projects in the US due to cost overruns and rising interest costs, among other things. We sold out of our remaining holding after the announcement when the stock fell significantly. On the positive side, our largest position, Novo Nordisk, the drug company at the forefront of the new class of drugs, GLP-1 agonists, to treat diabetes and obesity, saw its shares rise a further 8% in the quarter and therefore 50% for the year. The company delivered better than expected results and upgraded their full year expectations, owing to sustained demand for their diabetes product. Novo is one of the few names that was a strong performer in 2022 and 2023, yet we maintain it as our largest holding. We expect ongoing penetration of GLP-1 drugs in treatment of diabetes and increased supply of drugs for obesity to satisfy demand, to drive higher growth than the market anticipates in the coming quarters and years.
After a temporary headwind for our Fund in the third quarter, the last months of the year registered solid performance. Schneider Electric, one of our larger holdings, rose 17%, helped by continued strong growth delivered in their 3rd quarter results, as well as confirming strong demand for electrical infrastructure in several end markets such as data centres, EV infrastructure and electricity grid upgrades.
Outlook
The Fund continues to rely on bottom-up fundamental analysis and have used the strength to reduce cyclical exposure after the rally in the last quarter. If interest rates were to further decrease, it would undoubtedly provide support for our portfolio holdings. However, we remain cautious of the potential impact of weaker corporate and economic data, and the risk to earnings faced by cyclical businesses notwithstanding their quality. Looking into 2024, our perspective remains that there is a disproportionate downside risk for earnings per share and gross domestic product in this context and that bad news will start to be seen as detrimental. The potential for greater visibility in the market is expected to yield favourable outcomes, which is why we are committed to maintaining our position. Consequently, we aim to mitigate any potential risks associated with net cyclicality, beta, momentum, and illiquidity. Having added numerous names to the fund in 2022, when we picked up many high-quality names sold off in the volatility caused by rising rates, we have made few large changes to the portfolio in 2023. We have an investment horizon of 5 years, and we stick to our process of focusing on profitable companies with high returns on capital, reinvesting for growth. We believe these companies will continue to deliver the best long-term returns for investors.
1Stoxx 600 (Reinvested net dividends).
2Mark Denham took over the Fund on the 17/11/2016.

Carmignac Portfolio Grande Europe
Carmignac Portfolio Grande Europe A EUR Acc
- Empfohlene Mindestanlagedauer
- 5 Jahre
- Risikoskala*
- 4/7
- SFDR-Klassifizierung**
- Artikel 9
*Die Definition der Risikoskala finden Sie im KID/BIB (Basisinformationsblatt). Das Risiko 1 ist nicht eine risikolose Investition. Dieser Indikator kann sich im Laufe der Zeit verändern. **Die Offenlegungsverordnung (Sustainable Finance Disclosure Regulation - SFDR) 2019/2088. Die SFDR-Klassifizierung der Fonds kann sich im Laufe der Zeit ändern.
Hauptrisiken des Fonds
Kosten
- Einstiegskosten
- 4.00% des Betrags, den Sie beim Einstieg in diese Anlage zahlen. Dies ist der Höchstbetrag, der Ihnen berechnet wird. Carmignac Gestion erhebt keine Eintrittsgebühr. Die Person, die Ihnen das Produkt verkauft, teilt Ihnen die tatsächliche Gebühr mit.
- Ausstiegskosten
- Wir berechnen keine Ausstiegsgebühr für dieses Produkt.
- Verwaltungsgebühren und sonstige Verwaltungs- oder Betriebskosten
- 1.82% des Werts Ihrer Anlage pro Jahr. Hierbei handelt es sich um eine Schätzung auf der Grundlage der tatsächlichen Kosten des letzten Jahres.
- Erfolgsgebühren
- 20.00% wenn die Anteilsklasse während des Performancezeitraums den Referenzindikator übertrifft. Sie ist auch dann zahlbar, wenn die Anteilsklasse den Referenzindikator übertroffen, aber eine negative Performance verzeichnet hat. Minderleistung wird für 5 Jahre zurückgefordert. Der tatsächliche Betrag hängt davon ab, wie gut sich Ihre Investition entwickelt. Die obige aggregierte Kostenschätzung enthält den Durchschnitt der letzten 5 Jahre oder seit der Produkterstellung, wenn es weniger als 5 Jahre sind.
- Transaktionskosten
- 0.58% des Werts Ihrer Anlage pro Jahr. Hierbei handelt es sich um eine Schätzung der Kosten, die anfallen, wenn wir die Basiswerte für das Produkt kaufen oder verkaufen. Der tatsächliche Betrag hängt davon ab, wie viel wir kaufen und verkaufen.
Performance
| Carmignac Portfolio Grande Europe | +8.5 | −0.9 | +11.3 | +14.8 | −21.1 | +21.7 | +14.5 | +34.8 | −9.6 | +10.4 |
| Referenzindikator | +12.0 | +19.4 | +8.8 | +15.8 | −10.6 | +24.9 | −2.0 | +26.8 | −10.8 | +10.6 |
| Carmignac Portfolio Grande Europe | +10.1% | +1.9% | +7.9% |
| Referenzindikator | +17.2% | +9.1% | +9.4% |
Quelle: Carmignac Stand 30. Okt 2026.
Wertentwicklungen der Vergangenheit lassen keine Rückschlüsse auf zukünftige Wertverläufe zu. Wertentwicklung nach Gebühren (keine Berücksichtigung von Ausgabeaufschlägen die durch die Vertriebsstelle erhoben werden können) Der Fonds ist mit einem Kapitalverlustrisiko verbunden.
Bei den nicht währungsgesicherten Anteilen kann die Rendite aufgrund von Währungsschwankungen steigen oder fallen.
Referenzindikator: MSCI Europe NR index