
Performance Review

70% of our funds outperform and rank in the first quartile of their respective categories1.
Kevin THOZET
Portfolio Advisor & Member of the Investment Committee
Our assets under management increased from €33bn last January to €41bn today2. Net inflows have been diversified across flexible bonds, credit, global and emerging equities3, as well as alternative strategies.
- All equity indices are posting gains, and for the first time since 2017, emerging markets are outperforming developed markets. To fully capture regional allocation opportunities, currency risk management has been a key contributor, against the backdrop of a marked depreciation of the US dollar (-10%) in 2025.
- In a rising market that does not benefit all stocks equally, stock selection makes all the difference.
- Carmignac Investissement is up +17% in 2025, outperforming global equities3 by +10%. Carmignac Emergents is up +24%, outperforming its reference indicator by +7%.
- Our fixed income range continues to stand out: for the seventh consecutive year, almost the entire range has beaten its reference indicator.
- Beyond the consistency of relative performance, we can also highlight the steadiness of absolute performance, with ten consecutive quarters of positive returns for our flagship fixed income funds4.
- In other words, volatility has been well contained on Carmignac Sécurité and Carmignac P. Flexible Bond, while Carmignac P. Credit posted Sharpe ratios between 2 and 3.
- Our multi-asset funds continue to follow a constructive trajectory.
- Carmignac Patrimoine is up +12% in 2025, with more than +10% of outperformance, ranking in the first decile among its peers.1
Our macroeconomic outlook

Global growth remains unchanged at 3%, still supported by AI investment, national security spending and fiscal largesse.
Raphaël GALLARDO
Chief Economist

Europe
FISCAL ACTIVISM TO SUPPORT THE “SLEEPING BEAUTY”.
- The European cyclical recovery should materialise, supported by the German plan, Next Generation EU in Italy and the continuation of a virtuous cycle in Spain.
- The ECB is expected to favour a wait-and-see approach, as disinflation loses momentum amid a resilient labour market.

USA
BROAD-BASED STIMULUS: GROWTH TODAY, INFLATION TOMORROW?
- US growth shows no sign of slowing. Still driven by AI investment, the economy is running hot amid an accommodative Fed and Donald Trump’s fiscal activism. As the midterm elections approach, additional measures could further extend the run.
- Inflation is likely to remain durably above target due to a shrinking labour force and higher tariffs, but AI-driven productivity gains help mitigate the risk of second-round effects.

China
THE 15th FIVE-YEAR PLAN REASSERTS THE PRIORITY OF A WAR ECONOMY.
- China’s new Five-Year Plan prioritises technological self-sufficiency and the rollout of industrial AI. However, it includes no decisive measures to address the renewed downturn in the property sector or rising youth unemployment.
- In a persistently more protectionist environment, Beijing is expected to widen its fiscal deficit to sustain growth above 4%.
In focus
AI AS A STRATEGIC BATTLEGROUND SHAPING THE GLOBAL ECONOMY

Maxime CARMIGNAC
Chief Executive Officer of Carmignac UK Ltd.
AI AT CARMIGNAC: ACTIVE INVESTING.
- Our study on active management has shown that equity funds with strong convictions (active share5 > 80%) and operating within an open-architecture framework outperform their reference indicator, net of fees, by an average of 0.70% per year6, depending on the region.
- Having become a major geopolitical and industrial issue, AI requires a deep understanding of its use cases, value chain and risks. To address this, we have made targeted investments and built a dedicated team to identify value creation opportunities.

Frédéric LEROUX
Head of Cross Asset, Fund manager
IS THERE A BUBBLE IN ARTIFICIAL INTELLIGENCE?
- Since the beginning of the Industrial Revolution, bubbles have enabled the large-scale diffusion of major technological innovations throughout the economy.
- Investor euphoria, combined with the inability of companies in sectors disrupted by innovation to forego the massive investments required, facilitates this diffusion. The resulting process of creative destruction, as theorised by Schumpeter, can unfold over many years.
Our experts

Naomi WAISTELL
Fund Manager
EMERGING MARKETS: FROM IMITATORS TO INNOVATORS
- From memory and semiconductors to robotics and AI applications, EM companies lead key parts of the innovation cycle, with highest AI adoption rates. Physical AI is already embedded into the real economy, driving productivity gains and margin expansion.
- After years of underallocation, valuations remain attractive compared to developed markets, offering a credible alternative and diversification. The next EM cycle is about innovation, earnings and valuation discipline.
- Our EM strategies are well positioned to benefit from this structural shift, with selective positioning on key enablers across the AI value chain in Asia, coupled with exposure to domestic growth stories across India, SE Asia and Latin America.

Kristofer BARRETT
Head of Global Equities, Fund Manager
AI: THE DISRUPTED VS THE DISRUPTERS
- Token generation, a proxy for compute demand, continues to double roughly every two months.
- After the 2024 pre-training phase, AI in 2025 has absorbed most available human data, driving higher usage and sharply increasing compute needs. As data centres take years to build, supply cannot keep pace, creating capacity constraints and higher prices.
- We are refining our AI exposure by reducing companies facing excessive free cash flow pressure from aggressive investment plans, while favouring hardware names benefiting from the capex cycle.
- We are also building contrarian exposure to software, where AI is likely to be layered gradually onto existing systems rather than deployed disruptively.
Our asset allocation convictions for 2026

EQUITY MARKETS: BETWEEN CONFIRMED LEADERSHIP AND OVERLOOKED POCKETS OF VALUE.
Jacques HIRSCH
Fund Manager
- Nominal growth and fiscal expansion should continue to support equity markets, arguing in favour of active diversification:
- towards themes that remain well supported (technology, emerging markets, European cyclicals),
- and towards segments that have lagged, such as those perceived as “losers” of the AI wave, consumer sectors and healthcare.
- In an ongoing tense geopolitical environment, commodities appear attractive, with a preference for gold and copper.
- Bull markets often end with a phase of heightened volatility. It is therefore essential to prepare for this now, both in portfolio construction and in security selection.

THE US BOND MARKET DOES NOT REFLECT THE STRENGTH OF THE ECONOMY.
Guillaume RIGEADE
Co-Head of Fixed Income, Fund manager
- While European and Japanese rate markets have already registered the impact of lavish fiscal policy, US rates continue to hover at low levels. Resilient growth and inflation should strongly narrow this rate gap between regions.
- Our flexible management will enable us to benefit from the high carry on euro rates and the rising rate across the Atlantic.
- Furthermore, our broad investment universe will allow us to seize opportunities in the segments of emerging debt or inflation strategies which present attractive valuations.

REINFORCED SELECTIVITY ON THE CREDIT SIDE.
Pierre VERLÉ
Head of Credit, Co-Head of Fixed Income, Fund Manager
- After 3 years of tightening of credit spreads, 2026 should be marked by greater polarisation across both the Investment Grade and High Yield spectrum.
- Less favorable technical factors and increasing credit events will favour active management like ours.
- Generous embedded yields and high dispersion within the credit spectrum should allow us to deliver attractive risk-adjusted returns.
1 Morningstar data as at 31/12/2025.
2 Sources: Carmignac, as at 31/12/2025.
3 MSCI AC World.
4 Flagship funds: Carmignac Sécurité, Carmignac P. Credit and Target Maturity Funds. Data as of 31/12/2025.
5 Active share measures the degree of difference between the securities held in a portfolio and those of its benchmark.
6 Based on a rolling five-year performance over a total ten-year period.
Carmignac Investissement A EUR Acc
- Aanbevolen minimale beleggingstermijn
- 5 jaar
- SFDR-fondscategorieën**
- Artikel 8
- Risicoschaal*
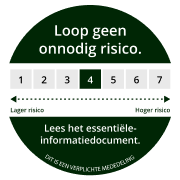
*Risicocategorie van het KID (essentiële-informatiedocument) indicator. Risicocategorie 1 betekent niet dat een belegging risicoloos is. Deze indicator kan in de loop van de tijd veranderen. **De Sustainable Finance Disclosure Regulation (SFDR) 2019/2088. De SFDR-classificatie van de fondsen kan in de loop van de tijd veranderen.
Voornaamste risico's van het Fonds
Kosten
- Instapkosten
- 4,00% van het bedrag dat u betaalt wanneer u in deze belegging instapt. Dit is het hoogste bedrag dat u in rekening zal worden gebracht. Carmignac Gestion brengt geen instapkosten in rekening. De persoon die verantwoordelijk is voor de verkoop van het product zal u informeren over de feitelijke kosten.
- Uitstapkosten
- Wij brengen voor dit product geen uitstapkosten in rekening.
- Beheerskosten en andere administratie - of exploitatiekos ten
- 1,80% van de waarde van uw belegging per jaar. Dit is een schatting op basis van de feitelijke kosten over het afgelopen jaar.
- Prestatievergoedingen
- 20,00% max. van de meerprestatie als het rendement sinds het begin van het boekjaar hoger is dan dat van de referentie-indicator en er geen minderprestatie uit het verleden meer moet worden goedgemaakt. Het feitelijke bedrag zal variëren naargelang van de prestaties van uw belegging. De schatting van de totale kosten hierboven omvat het gemiddelde over de afgelopen vijf jaar, of sinds de introductie van het product als dat minder dan vijf jaar geleden is.
- Transactiekosten
- 0,35% van de waarde van uw belegging per jaar. Dit is een schatting van de kosten die ontstaan wanneer we de onderliggende beleggingen voor het product kopen en verkopen. Het feitelijke bedrag zal variëren naargelang hoeveel we kopen en verkopen.
Rendement
| Carmignac Investissement | +17,4 | +25,0 | +18,9 | −18,3 | +4,0 | +33,7 | +24,7 | −14,2 | +4,8 | +2,1 |
| Referentie-indicator | +7,9 | +25,3 | +18,1 | −13,0 | +27,5 | +6,7 | +28,9 | −4,8 | +8,9 | +11,1 |
| Carmignac Investissement | +20,4% | +8,2% | +8,5% |
| Referentie-indicator | +16,8% | +12,1% | +10,8% |
Bron: Carmignac op 31 dec. 2025.
In het verleden behaalde resultaten zijn geen garantie voor de toekomst. De resultaten zijn netto na aftrek van kosten (inclusief mogelijke in rekening gebrachte instapkosten door de distributeur) . Het fonds houdt een risico op kapitaalverlies in.
Het rendement kan stijgen of dalen als gevolg van valutaschommelingen voor de aandelen die niet valutadekkend zijn.
Referentie-indicator: MSCI AC World NR index
Carmignac Emergents A EUR Acc
- Aanbevolen minimale beleggingstermijn
- 5 jaar
- SFDR-fondscategorieën**
- Artikel 9
- Risicoschaal*
*Risicocategorie van het KID (essentiële-informatiedocument) indicator. Risicocategorie 1 betekent niet dat een belegging risicoloos is. Deze indicator kan in de loop van de tijd veranderen. **De Sustainable Finance Disclosure Regulation (SFDR) 2019/2088. De SFDR-classificatie van de fondsen kan in de loop van de tijd veranderen.
Voornaamste risico's van het Fonds
Kosten
- Instapkosten
- 4,00% van het bedrag dat u betaalt wanneer u in deze belegging instapt. Dit is het hoogste bedrag dat u in rekening zal worden gebracht. Carmignac Gestion brengt geen instapkosten in rekening. De persoon die verantwoordelijk is voor de verkoop van het product zal u informeren over de feitelijke kosten.
- Uitstapkosten
- Wij brengen voor dit product geen uitstapkosten in rekening.
- Beheerskosten en andere administratie - of exploitatiekos ten
- 1,80% van de waarde van uw belegging per jaar. Dit is een schatting op basis van de feitelijke kosten over het afgelopen jaar.
- Prestatievergoedingen
- 20,00% max. van de meerprestatie als het rendement sinds het begin van het boekjaar hoger is dan dat van de referentie-indicator en er geen minderprestatie uit het verleden meer moet worden goedgemaakt. Het feitelijke bedrag zal variëren naargelang van de prestaties van uw belegging. De schatting van de totale kosten hierboven omvat het gemiddelde over de afgelopen vijf jaar, of sinds de introductie van het product als dat minder dan vijf jaar geleden is.
- Transactiekosten
- 0,35% van de waarde van uw belegging per jaar. Dit is een schatting van de kosten die ontstaan wanneer we de onderliggende beleggingen voor het product kopen en verkopen. Het feitelijke bedrag zal variëren naargelang hoeveel we kopen en verkopen.
Rendement
| Carmignac Emergents | +23,1 | +4,6 | +9,5 | −15,6 | −10,7 | +44,7 | +24,7 | −18,6 | +18,8 | +1,4 |
| Referentie-indicator | +17,8 | +14,7 | +6,1 | −14,9 | +4,9 | +8,5 | +20,6 | −10,3 | +20,6 | +14,5 |
| Carmignac Emergents | +12,1% | +1,2% | +6,5% |
| Referentie-indicator | +12,7% | +5,0% | +7,6% |
Bron: Carmignac op 31 dec. 2025.
In het verleden behaalde resultaten zijn geen garantie voor de toekomst. De resultaten zijn netto na aftrek van kosten (inclusief mogelijke in rekening gebrachte instapkosten door de distributeur) . Het fonds houdt een risico op kapitaalverlies in.
Het rendement kan stijgen of dalen als gevolg van valutaschommelingen voor de aandelen die niet valutadekkend zijn.
Referentie-indicator: MSCI EM NR index
Carmignac Patrimoine A EUR Acc
- Aanbevolen minimale beleggingstermijn
- 3 jaar
- SFDR-fondscategorieën**
- Artikel 8
- Risicoschaal*

*Risicocategorie van het KID (essentiële-informatiedocument) indicator. Risicocategorie 1 betekent niet dat een belegging risicoloos is. Deze indicator kan in de loop van de tijd veranderen. **De Sustainable Finance Disclosure Regulation (SFDR) 2019/2088. De SFDR-classificatie van de fondsen kan in de loop van de tijd veranderen.
Voornaamste risico's van het Fonds
Kosten
- Instapkosten
- 4,00% van het bedrag dat u betaalt wanneer u in deze belegging instapt. Dit is het hoogste bedrag dat u in rekening zal worden gebracht. Carmignac Gestion brengt geen instapkosten in rekening. De persoon die verantwoordelijk is voor de verkoop van het product zal u informeren over de feitelijke kosten.
- Uitstapkosten
- Wij brengen voor dit product geen uitstapkosten in rekening.
- Beheerskosten en andere administratie - of exploitatiekos ten
- 1,80% van de waarde van uw belegging per jaar. Dit is een schatting op basis van de feitelijke kosten over het afgelopen jaar.
- Prestatievergoedingen
- 20,00% max. van de meerprestatie als het rendement sinds het begin van het boekjaar hoger is dan dat van de referentie-indicator en er geen minderprestatie uit het verleden meer moet worden goedgemaakt. Het feitelijke bedrag zal variëren naargelang van de prestaties van uw belegging. De schatting van de totale kosten hierboven omvat het gemiddelde over de afgelopen vijf jaar, of sinds de introductie van het product als dat minder dan vijf jaar geleden is.
- Transactiekosten
- 0,32% van de waarde van uw belegging per jaar. Dit is een schatting van de kosten die ontstaan wanneer we de onderliggende beleggingen voor het product kopen en verkopen. Het feitelijke bedrag zal variëren naargelang hoeveel we kopen en verkopen.
Rendement
| Carmignac Patrimoine | +12,1 | +7,1 | +2,2 | −9,4 | −0,9 | +12,4 | +10,5 | −11,3 | +0,1 | +3,9 |
| Referentie-indicator | +1,1 | +11,4 | +7,7 | −10,3 | +13,3 | +5,2 | +18,2 | −0,1 | +1,5 | +8,1 |
| Carmignac Patrimoine | +7,0% | +2,0% | +2,4% |
| Referentie-indicator | +6,7% | +4,3% | +5,3% |
Bron: Carmignac op 31 dec. 2025.
In het verleden behaalde resultaten zijn geen garantie voor de toekomst. De resultaten zijn netto na aftrek van kosten (inclusief mogelijke in rekening gebrachte instapkosten door de distributeur) . Het fonds houdt een risico op kapitaalverlies in.
Het rendement kan stijgen of dalen als gevolg van valutaschommelingen voor de aandelen die niet valutadekkend zijn.
Referentie-indicator: 40% MSCI AC World NR index + 40% ICE BofA Global Government Index + 20% €STR Capitalized Index. Frequentie van herweging: Driemaandelijks
Carmignac Portfolio Flexible Bond F EUR Acc
- Aanbevolen minimale beleggingstermijn
- 3 jaar
- SFDR-fondscategorieën**
- Artikel 8
- Risicoschaal*

*Risicocategorie van het KID (essentiële-informatiedocument) indicator. Risicocategorie 1 betekent niet dat een belegging risicoloos is. Deze indicator kan in de loop van de tijd veranderen. **De Sustainable Finance Disclosure Regulation (SFDR) 2019/2088. De SFDR-classificatie van de fondsen kan in de loop van de tijd veranderen.
Voornaamste risico's van het Fonds
Carmignac Portfolio Credit F EUR Acc
- Aanbevolen minimale beleggingstermijn
- 3 jaar
- SFDR-fondscategorieën**
- Artikel 6
- Risicoschaal*
*Risicocategorie van het KID (essentiële-informatiedocument) indicator. Risicocategorie 1 betekent niet dat een belegging risicoloos is. Deze indicator kan in de loop van de tijd veranderen. **De Sustainable Finance Disclosure Regulation (SFDR) 2019/2088. De SFDR-classificatie van de fondsen kan in de loop van de tijd veranderen.
Voornaamste risico's van het Fonds
Carmignac Sécurité AW EUR Acc
- Aanbevolen minimale beleggingstermijn
- 2 jaar
- SFDR-fondscategorieën**
- Artikel 8
- Risicoschaal*
*Risicocategorie van het KID (essentiële-informatiedocument) indicator. Risicocategorie 1 betekent niet dat een belegging risicoloos is. Deze indicator kan in de loop van de tijd veranderen. **De Sustainable Finance Disclosure Regulation (SFDR) 2019/2088. De SFDR-classificatie van de fondsen kan in de loop van de tijd veranderen.